

 For New Traders
 For Breakeven Traders
 For Profitable Traders
Edgewonk Adds Deeper Trading Analytics to Chart Lab
This week, Edgewonk received one major upgrade.
1 min read
This week, Edgewonk received one major upgrade.
For more than 10 years, traders have known Edgewonk as a trading journal built to improve discipline, track mistakes, understand trading behavior, and work on the mental side of performance. That will always remain one of Edgewonk’s biggest strengths.
But this new update adds a completely new layer.
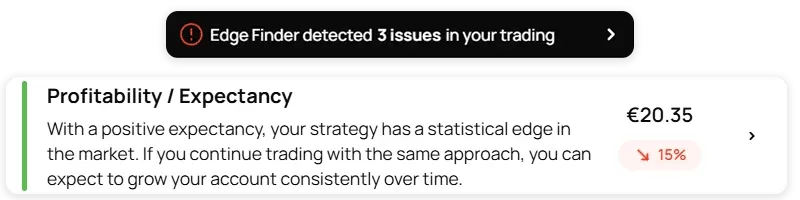
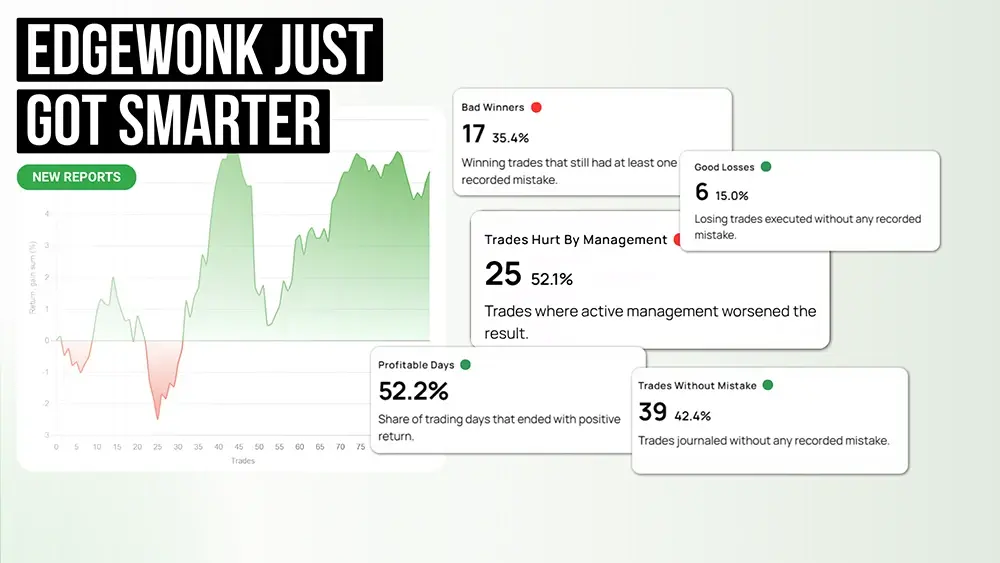
With the new analytical reports inside Chart Lab, Edgewonk now helps traders go much deeper into their performance data. You can uncover hidden patterns, analyze trade management, evaluate consistency, spot performance leaks, and better understand what is actually driving your results.
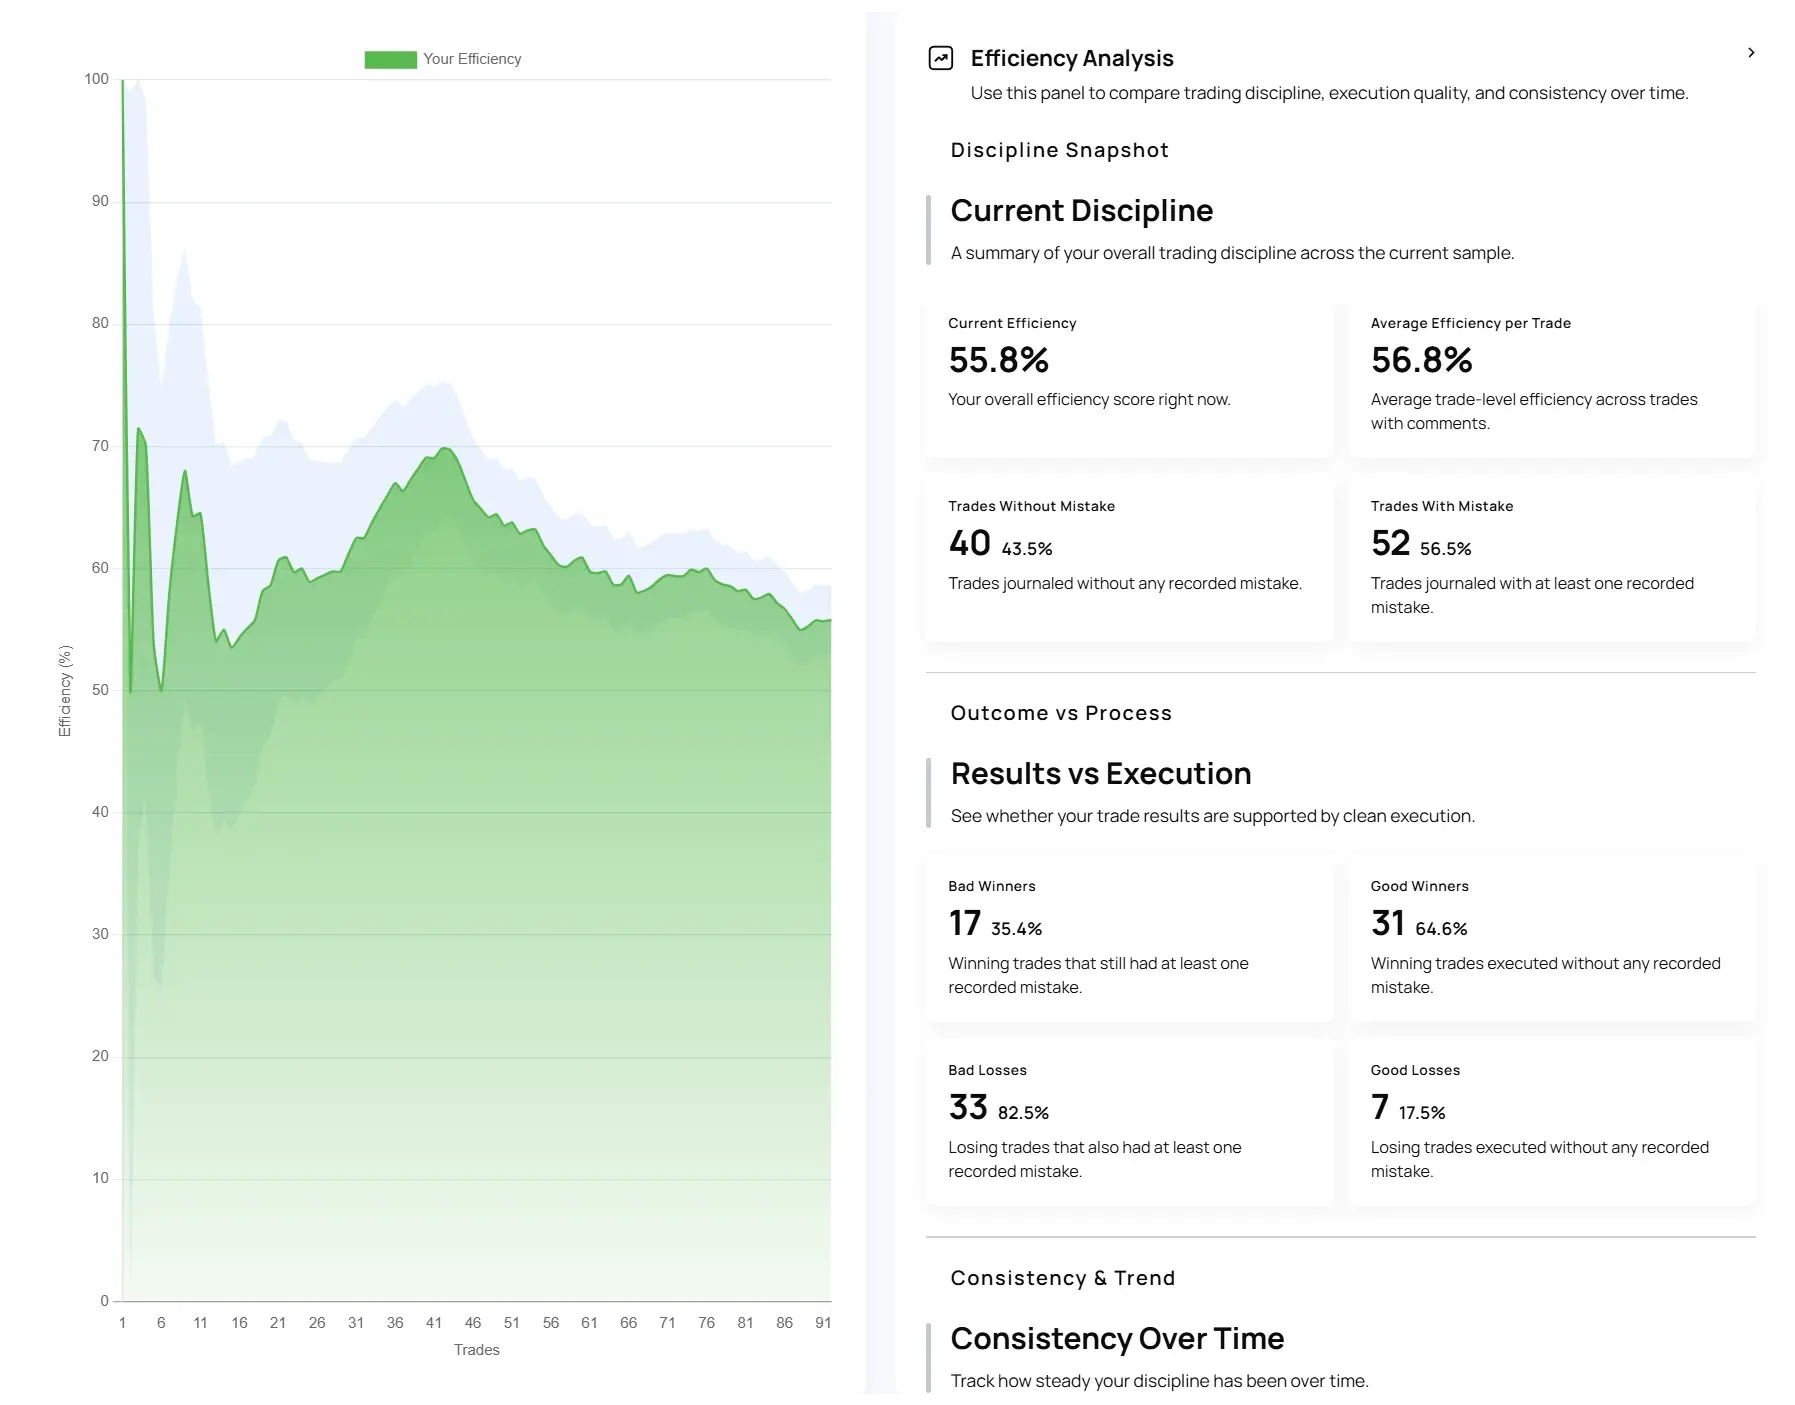
This is a major step toward making Edgewonk a true all-in-one trading journal platform: combining powerful mental analytics with deep performance analysis in one place.
With this update, we expanded the analytical layer inside Edgewonk’s Chart Lab.
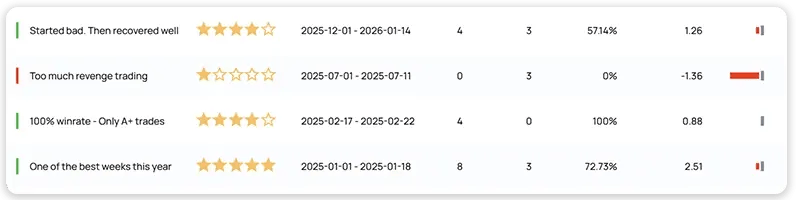
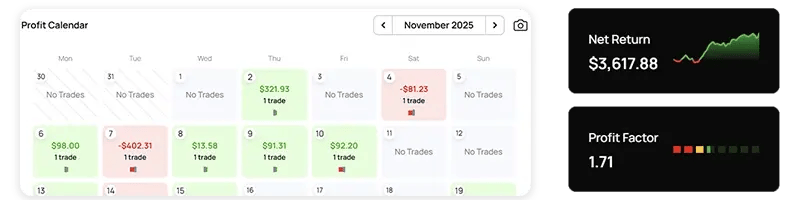
 Previously, many Chart Lab reports focused mainly on visualizing your trading data through charts. That already helped traders spot patterns, compare performance, and review different areas of their trading. But with the new update, the key reports now include additional analytical panels that bring much more context to the data.
 These new panels show supporting statistics, deeper performance breakdowns, and important data points directly next to the charts. This makes it easier to understand not just what happened in your trading, but also why it happened and where your biggest improvement opportunities may be.
 Instead of looking at a chart and trying to interpret everything manually, traders can now use the added metrics to analyze areas such as trade management, consistency, profitability, trade management, exit strategies, and performance leaks much faster.
The goal of this update is simple: give traders a clearer, deeper, and more structured way to understand their trading performance.
In the video below, we walk through the new Chart Lab update and show how the new analytical panels work inside Edgewonk.
You will see how the expanded reports add more data, more context, and more actionable insights to your trading journal. We also explain how traders can use the new analytics to find hidden patterns, understand what is driving their results, and identify areas where small improvements could have a meaningful impact over time.
This week, Edgewonk received one major upgrade.
Many traders think of journaling as extra admin work after the trade is already over. But a good trading journal is not just a place where you store...
A trading journal is one of the most important tools a trader can use to improve their performance. It helps you record your trades, review your...