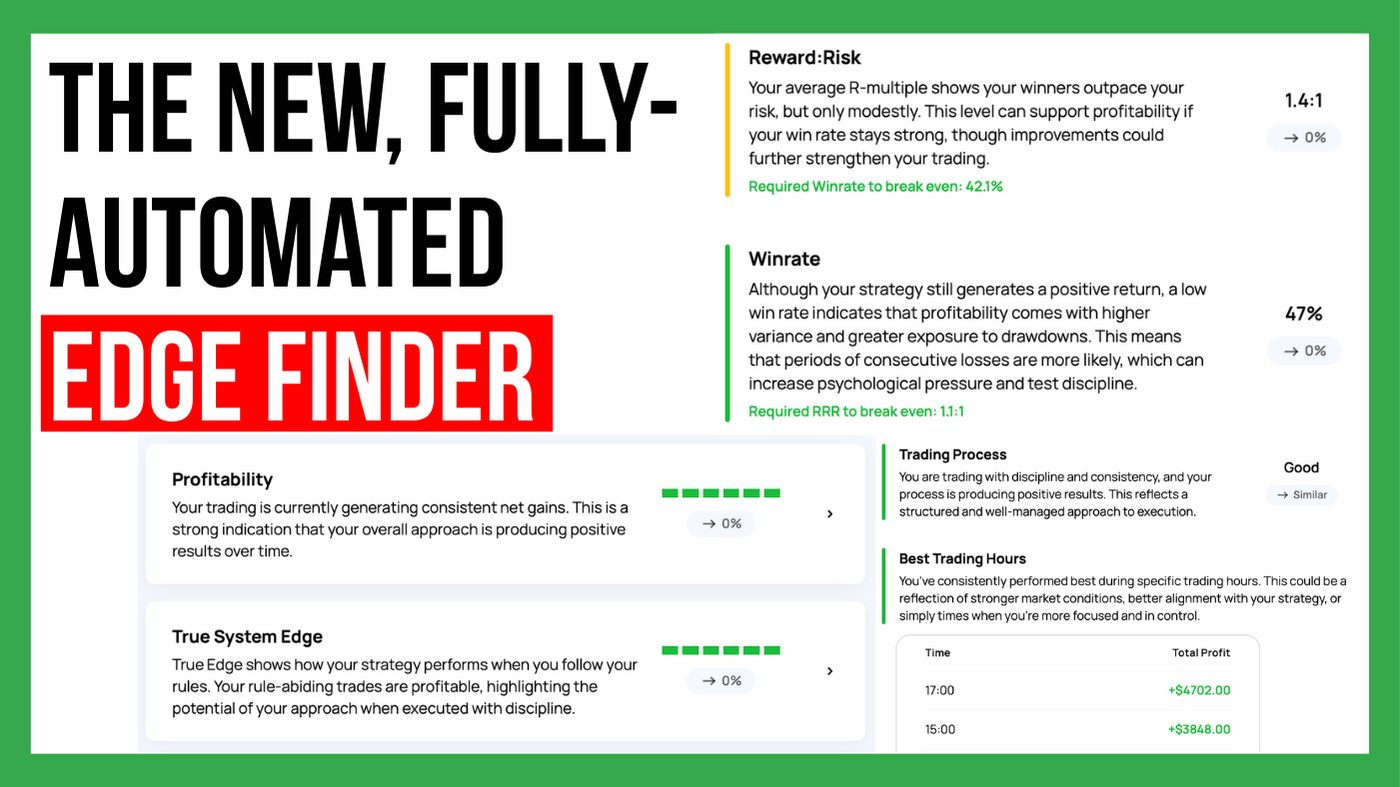
The Edgewonk Edge Finder is here
Most trading platforms are currently adding AI chatbots that let users interact with their data. The promise sounds great. Ask your journal anything...

Indicators are an integral part of most trading strategies – they help traders with interpreting the price action more objectively and guiding their decision-making.
However, efficiently tracking and evaluating their impact requires a structured approach. Edgewonk enables traders to record and analyze any indicator condition they’d like.
This article explores the top 10 trading indicators and demonstrates how to track them in Edgewonk to enhance insights into your trading strategy and its optimization.
Moving averages are the most popular trend-following indicator and they can be used in many different ways. Traditionally, traders use moving averages as a trend-filter, or to identify pullback price levels for trend-following entries.
Simple Moving Average (SMA): Tracks average prices over a set period to reveal trend direction, weighing every data point the same.
Exponential Moving Average (EMA): Reacts quicker to price changes than the SMA, focusing more on recent data.
Hull Moving Average (HMA): Combines smoothness and responsiveness to minimize lag and to react to trend changes faster.
Tracking moving averages in Edgewonk:
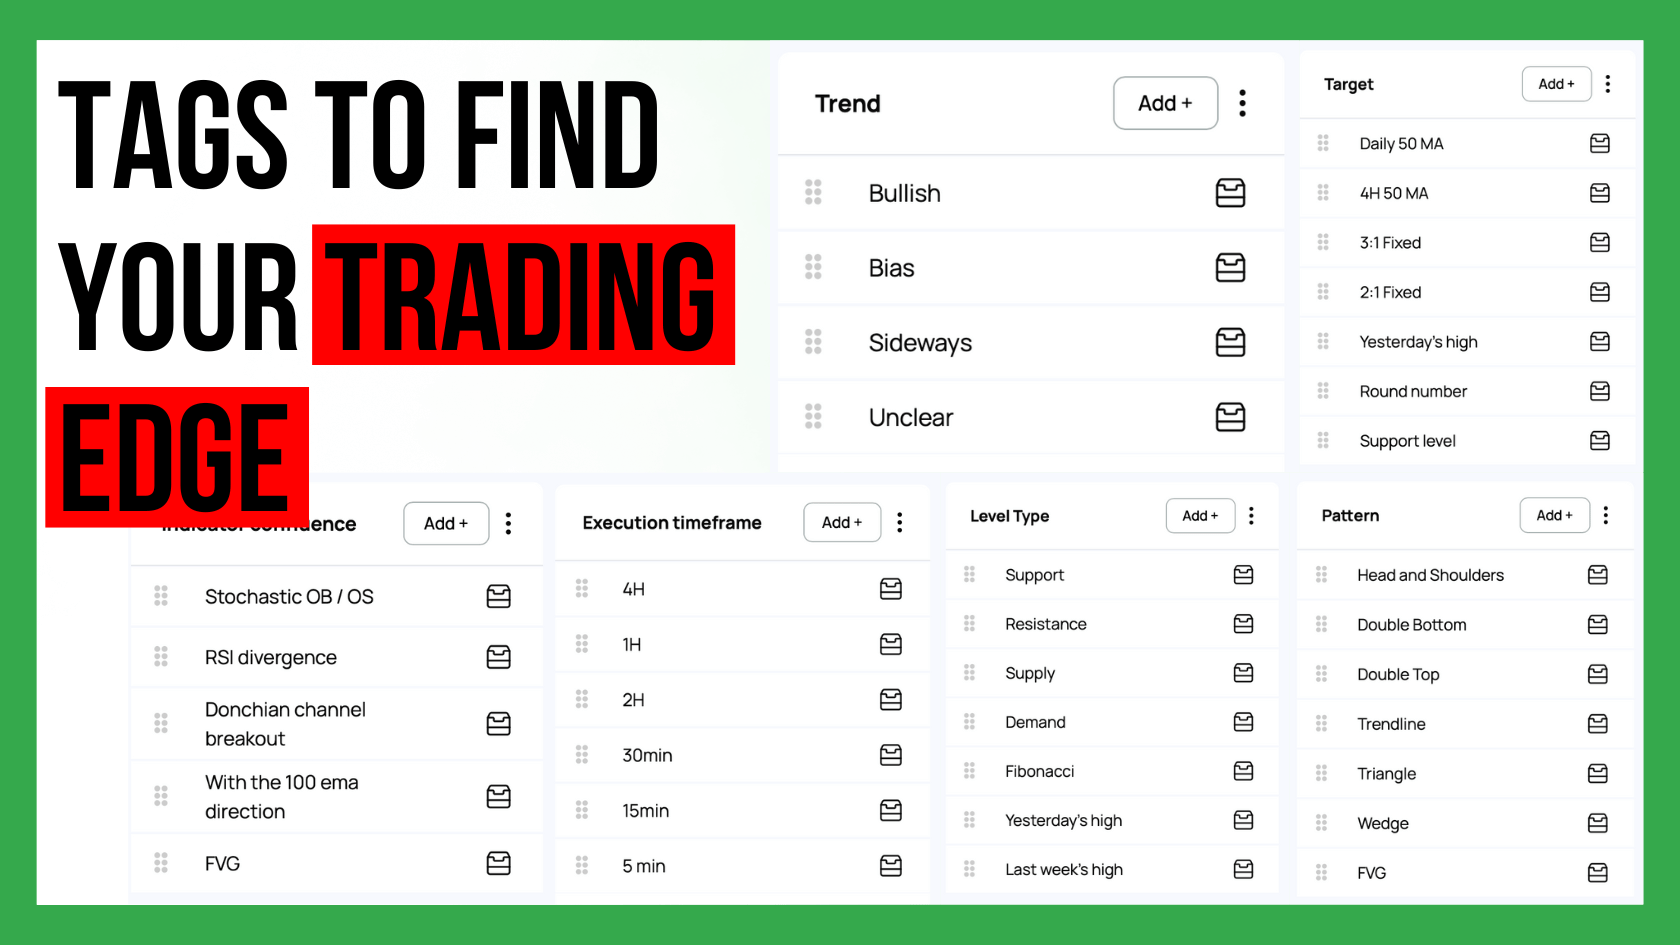
Create custom statistic tags based on how you are using the moving averages – whether that be a crossover of 2 moving averages, the moving average direction, price crossing the moving average or bouncing from it, whether multiple moving averages are lined up nicely to identify trends, and so on. The possibilities are endless.
Tracking the position and angle of a moving average from a higher timeframe may also provide valuable insights. Especially traders using a multi-timeframe approach can benefit from tracking HTF indicator values and conditions.

The MACD indicator measures the relationship between two moving averages to identify trend reversals, trend continuations and momentum shifts. Essentially, the MACD is a complete moving average crossover system combined in one tool.
Tracking in Edgewonk:
With the custom tags, you can tag bullish or bearish crossovers of the MACD, any divergences that might be present at the time of your trade entry, whether the histogram is above or below 0, and any other condition you can think of which is part of your setup rules.
The RSI evaluates price momentum to detect overbought (typically >70) or oversold (typically <30) conditions. The RSI can also be used with divergence or as a trend continuation tool.
The most common use case, however, is for analyzing the strength of a trending move.
Tracking in Edgewonk:
In your Custom Statistics, track oversold or overbought conditions, bullish and bearish divergences, crossing the middle line, or even trendline breaks of the RSI.
The STOCHASTIC indicator compares an instrument’s closing price to its price range over a specified period, predicting potential turning points and identifying momentum. Traders often use this indicator to trade pullbacks in established trends.
A high STOCHASTIC value indicates a strong bullish trend and can be used in a trend-following trading system.
Tracking in Edgewonk:
Use labels such as “Stochastic Overbought” or “Stochastic Crossover” – similar to the RSI, divergences can also be tracked.
Tracking the indicator value from a higher timeframe can also provide interesting insights about the higher timeframe trend dynamic.
The Bollinger Bands measure price volatility and highlight overbought or oversold zones based on price deviations from a moving average.
Commonly, the price trades within the Bollinger Bands most of the time. During extreme trending conditions, the price may also shoot beyond the Bollinger Bands. A Bollinger Band exhaustion exists when the price fails to reach the outer Bollinger Bands during an extended trending market, foreshadowing a potential trend reversal.

Tracking in Edgewonk:
You can name setups in Edgewonk, as well, for example “Bollinger Band Breakout” or “Bollinger Band Squeeze“, depending on your strategy – and then have a checklist with setup conditions in the form of custom stats!
You could also track the numerical values of the Bollinger Band Width with custom stats if you are trading breakouts from tight consolidations, or conditions like “Price closed above the BB” for reversal strategies.
The VWAP calculates the average trading price based on volume and price, helping traders gauge institutional activity – an absolute standard tool for most stock traders, and many futures traders.
Tracking in Edgewonk:
Use terms like “VWAP Breakout” or “VWAP Support/Resistance Test“, whether the price is above or below the VWAP, whether price has previously respected the VWAP, and so on.
Pivot Points calculate support and resistance levels based on previous day’s high, low, and close. Whereas day traders use the daily Pivot Points, swing traders typically opt for the use of weekly Pivot Points to get a sense of long-term price activity.
Tracking in Edgewonk:
Set up custom tags based on which pivot point you are trading and whether it is a reversal trade or a break and retest trade. Tracking the exact S and R Pivot Point level for your trade entries may provide helpful insights into your setup quality.
The ADX indicator measures trend strength to distinguish between trending and ranging markets. When the ADX is above 30, the price is in a trending situation, whereas an ADX below 30 marks a range-bound market.
Tracking in Edgewonk:
Mark trades with conditions like “ADX Strong Trend” or “ADX Weak Trend“ or “ADX above 20” – you could also track the numerical values of the ADX here, in steps of 5, if you want to be more accurate. The higher the ADX value, the stronger the trend.
This indicator identifies trend direction and potential reversals, ideal for setting stop-loss levels and trailing trades in profit.
Tracking in Edgewonk:
You could, for example, track conditions like “SAR Reversal” or “SAR Continuation”. If you use this indicator to trail your trade, you can also track different exit conditions via alternative strategies to see which performs best. Whether price has to close beyond the PSAR, whether you want a PSAR switch, or if different settings of the PSAR worked better or worse – anything is possible in Edgewonk.
The Ichimoku Cloud indicator is an all-in-one trading indicator offering a comprehensive analysis of trend direction, momentum, and support/resistance zones using multiple components.
Tracking in Edgewonk:
This indicator is so complex and powerful that Edgewonk can really flex its muscles when tracking all of its conditions – whether that be a bullish or bearish cloud, price crossing through the cloud, how wide the cloud is, price bouncing from the tenkan line, the kijun crossing the tenkan, and so on and so on.
Again, any rule that you introduce to your system you can track with ease in our journal. Plus, any exit rules you might be using you can track, as well, and much more.

Edgewonk simplifies the process of tracking, analyzing, and optimizing trading strategies, no matter what type of strategy.
Mastering technical indicators is just the first step; tracking and analyzing their effectiveness is where growth happens. Edgewonk offers an advanced framework to organize and review trades, enabling traders to identify patterns, eliminate weak strategies, and double down on profitable setups.
By integrating Edgewonk into your trading, you’ll not only sharpen your technical skills but also gain deeper insights into market behavior and, most importantly, your own behavior —helping you trade smarter and with greater confidence.

Most trading platforms are currently adding AI chatbots that let users interact with their data. The promise sounds great. Ask your journal anything...

Custom statistics can turn a trading journal into a powerful source of insight because they show the specific conditions that shape your performance....

Choosing how many trading strategies you should trade is one of the most important decisions for long term success. Many traders believe that more...