

 For New Traders
 For Breakeven Traders
 For Profitable Traders
Edgewonk Adds Deeper Trading Analytics to Chart Lab
This week, Edgewonk received one major upgrade.
1 min read
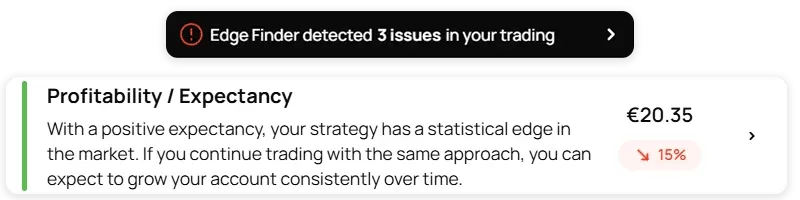
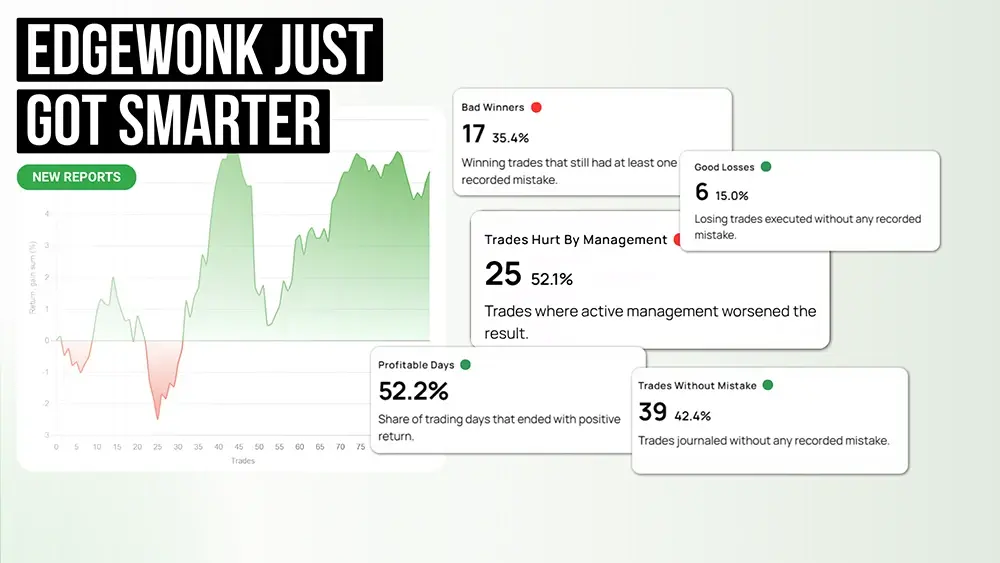
We’re excited to introduce new features to the Edgewonk Trading Journal, designed to enhance your analysis and provide deeper insights into your trading performance. This update includes analytical tables in Chart Lab graphs and new performance tiles across different sections.
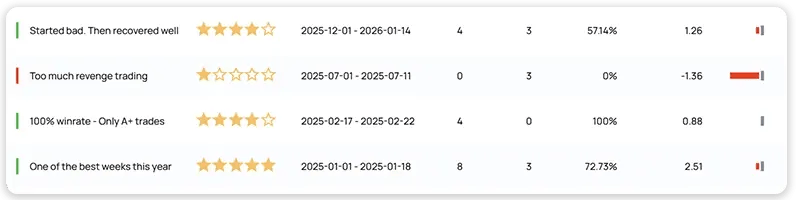
We’ve added analytical tables beneath select graphs in the Chart Lab to provide additional data insights. These tables display key statistics and breakdowns of the graph’s data samples, making it easier to interpret trends and refine your trading strategy.

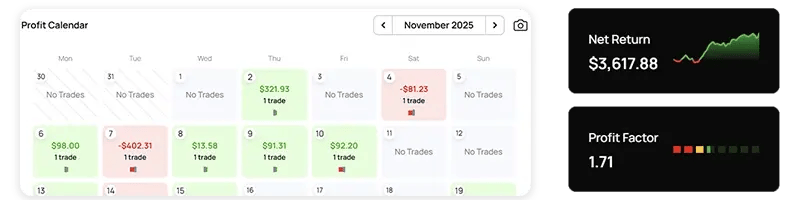
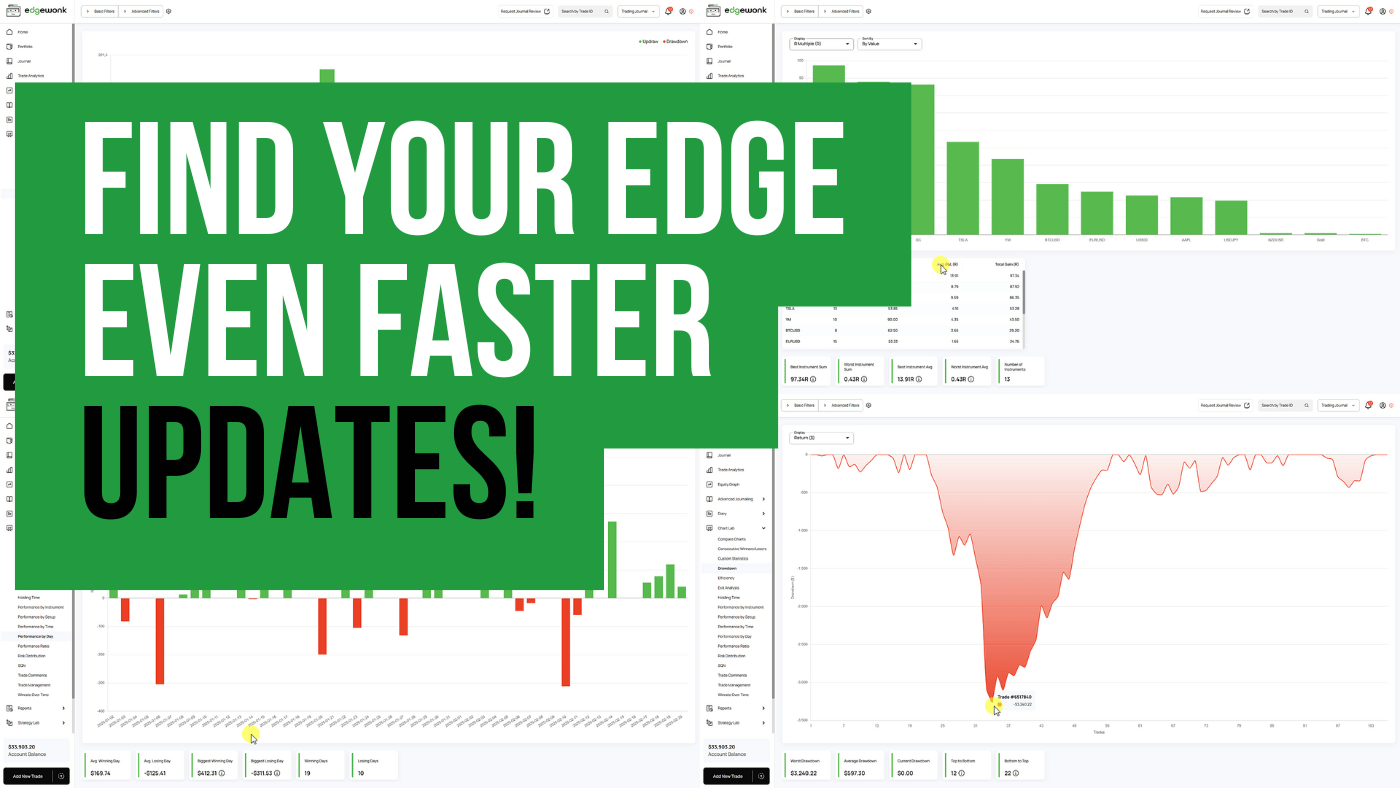
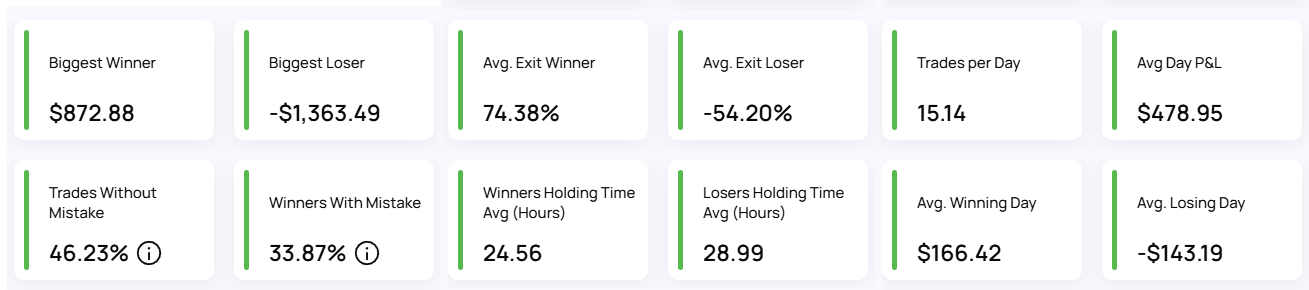
We’ve introduced several new performance tiles to different sections of the Chart Lab, allowing you to track key metrics more effectively. Here’s a breakdown of what’s new:
Top to bottom: How many trades did it take go from an account peak to the worst drawdown.
Bottom to top: How many trades did it take to go from the worst drawdown back to an account peak.
Trades without mistake: How many trades (in percentage) have no negative trade comment attached.
Losses with mistake: How many losses (in percentage) have at least one negative trade comment attached.
Winners with mistake: How many winners (in percentage) have at least one negative trade comment attached.
Trades hit TP: On how many of your trades (in percentage) has the price hit the take profit level.
Trades hit SL: On how many of your trades (in percentage) has the price hit the stop loss level.
Trades per day: How many trades do you take on average.
Avg Day P&L: Your average profit (or loss) per trading day.
Trades managed correctly: How often (in percentage) did you close a trade at (or beyond) the take profit was hit.
Trades managed incorrectly: How often (in percentage) did you close a trade before the take profit was hit where the price would have gone on to the take profit.
With these new updates, Edgewonk continues to evolve as a powerful tool for traders looking to refine their strategies and make data-driven decisions. The enhanced graph tables and performance tiles provide deeper insights into your trading habits, helping you identify strengths and areas for improvement. Log in now to explore the latest features and take your trading analysis to the next level!
This week, Edgewonk received one major upgrade.
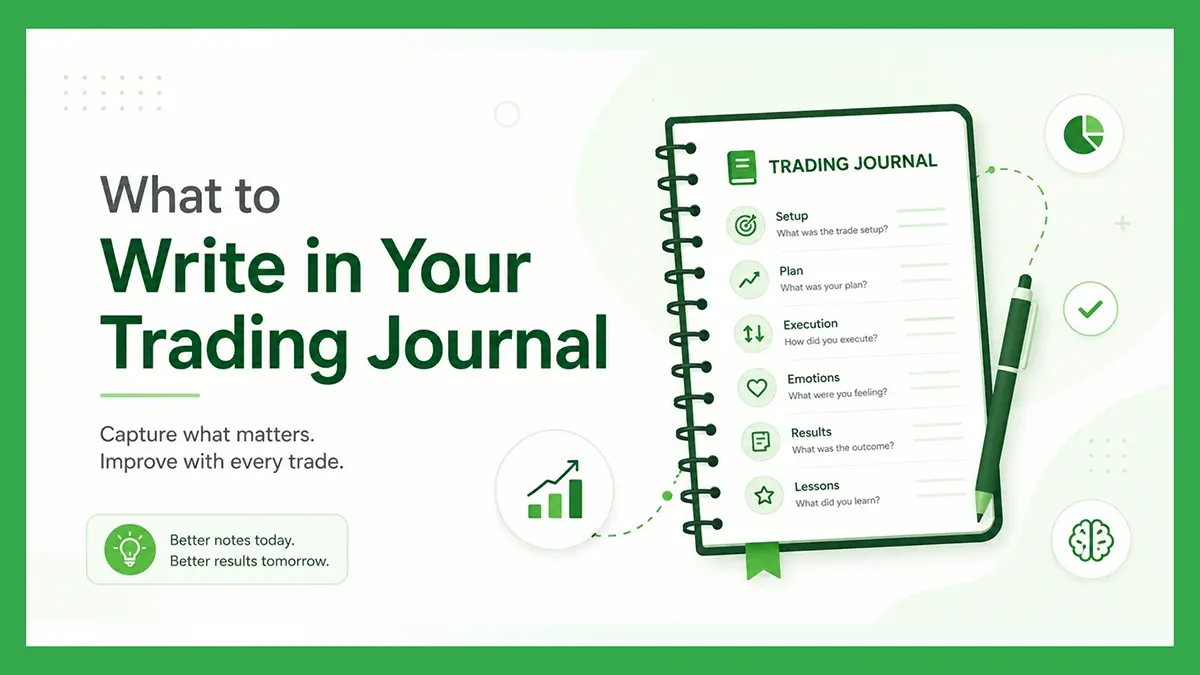
Many traders think of journaling as extra admin work after the trade is already over. But a good trading journal is not just a place where you store...
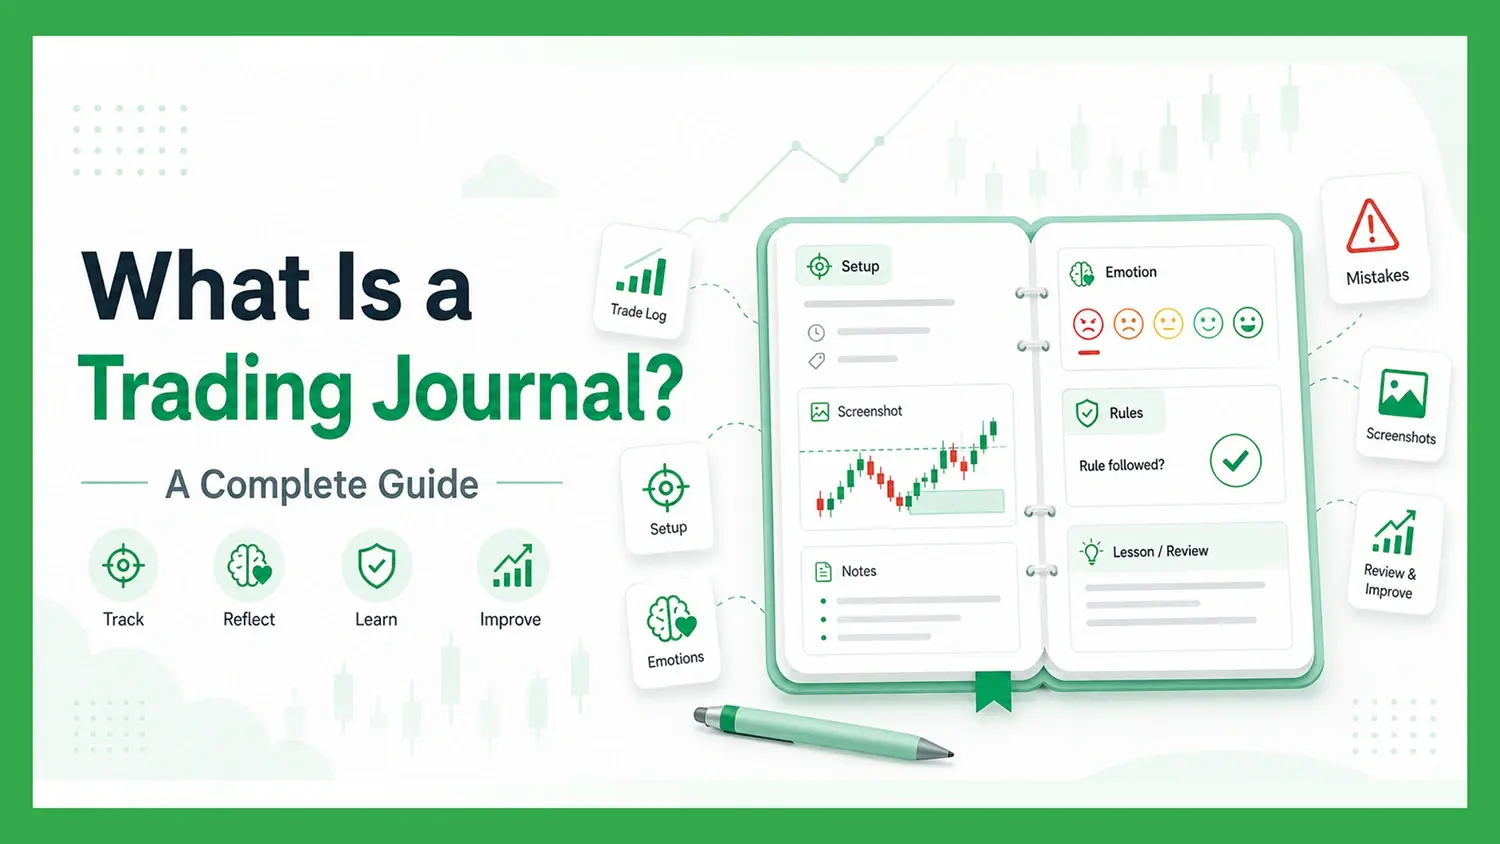
A trading journal is one of the most important tools a trader can use to improve their performance. It helps you record your trades, review your...