

 For New Traders
 For Breakeven Traders
 For Profitable Traders
Edgewonk Adds Deeper Trading Analytics to Chart Lab
This week, Edgewonk received one major upgrade.
4 min read
If you want to improve as a trader, tracking the right metrics is a game-changer. It’s the difference between making informed decisions and just hoping for the best. Without data, you’re basically guessing—and that usually leads to inconsistent results.
That’s where the Edgewonk trading journal comes in. It’s designed to give you clear, actionable insights into your trading performance, so you can see what’s working, what’s not, and where you can improve.
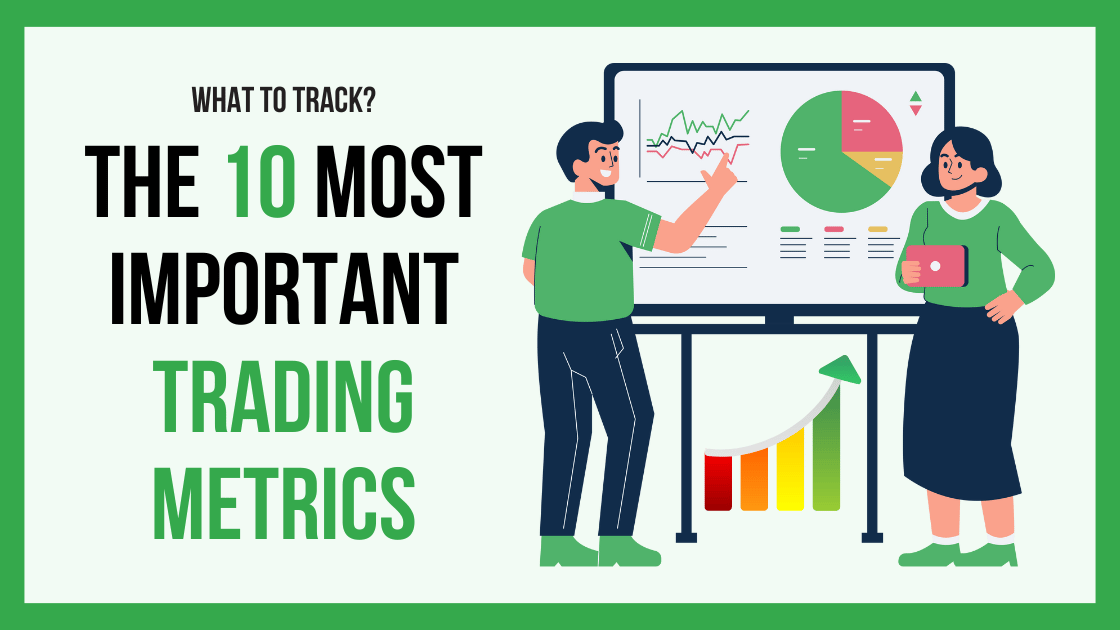
In this article, we’ll walk you through the ten most important things to track in Edgewonk to help you trade smarter and more confidently.
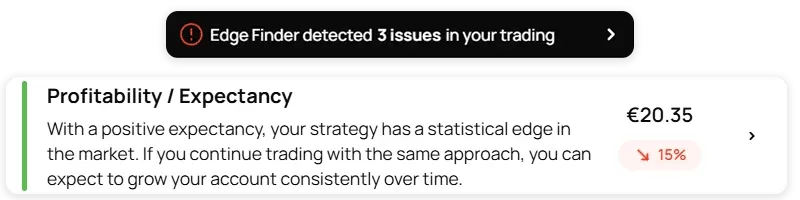
These three metrics determine a trader’s long-term profitability and are the cornerstone of any performance review:
Although the win rate alone isn’t particularly meaningful, when combined with the reward-to-risk ratio, it helps traders draw important conclusions about their profitability. A high win rate with a poor risk-reward ratio can still lead to losses, while a low win rate with a strong risk-reward ratio can be profitable. Understanding the balance is key.

How Edgewonk Tracks It
Edgewonk automatically calculates win rate and risk-reward ratio, combining them to determine expectancy. This allows traders to assess whether their strategy is mathematically sound and profitable over time.

Efficient execution means sticking to the trading plan and minimizing mistakes. Common execution mistakes include:
Tracking these errors helps traders pinpoint behavioral patterns that hurt performance.
How Edgewonk Tracks It
Edgewonk allows traders to tag each trade with mistakes or good executions and track their frequency. This helps traders identify recurring execution issues and work on improving discipline and decision-making, which is crucial to achieve profitability.
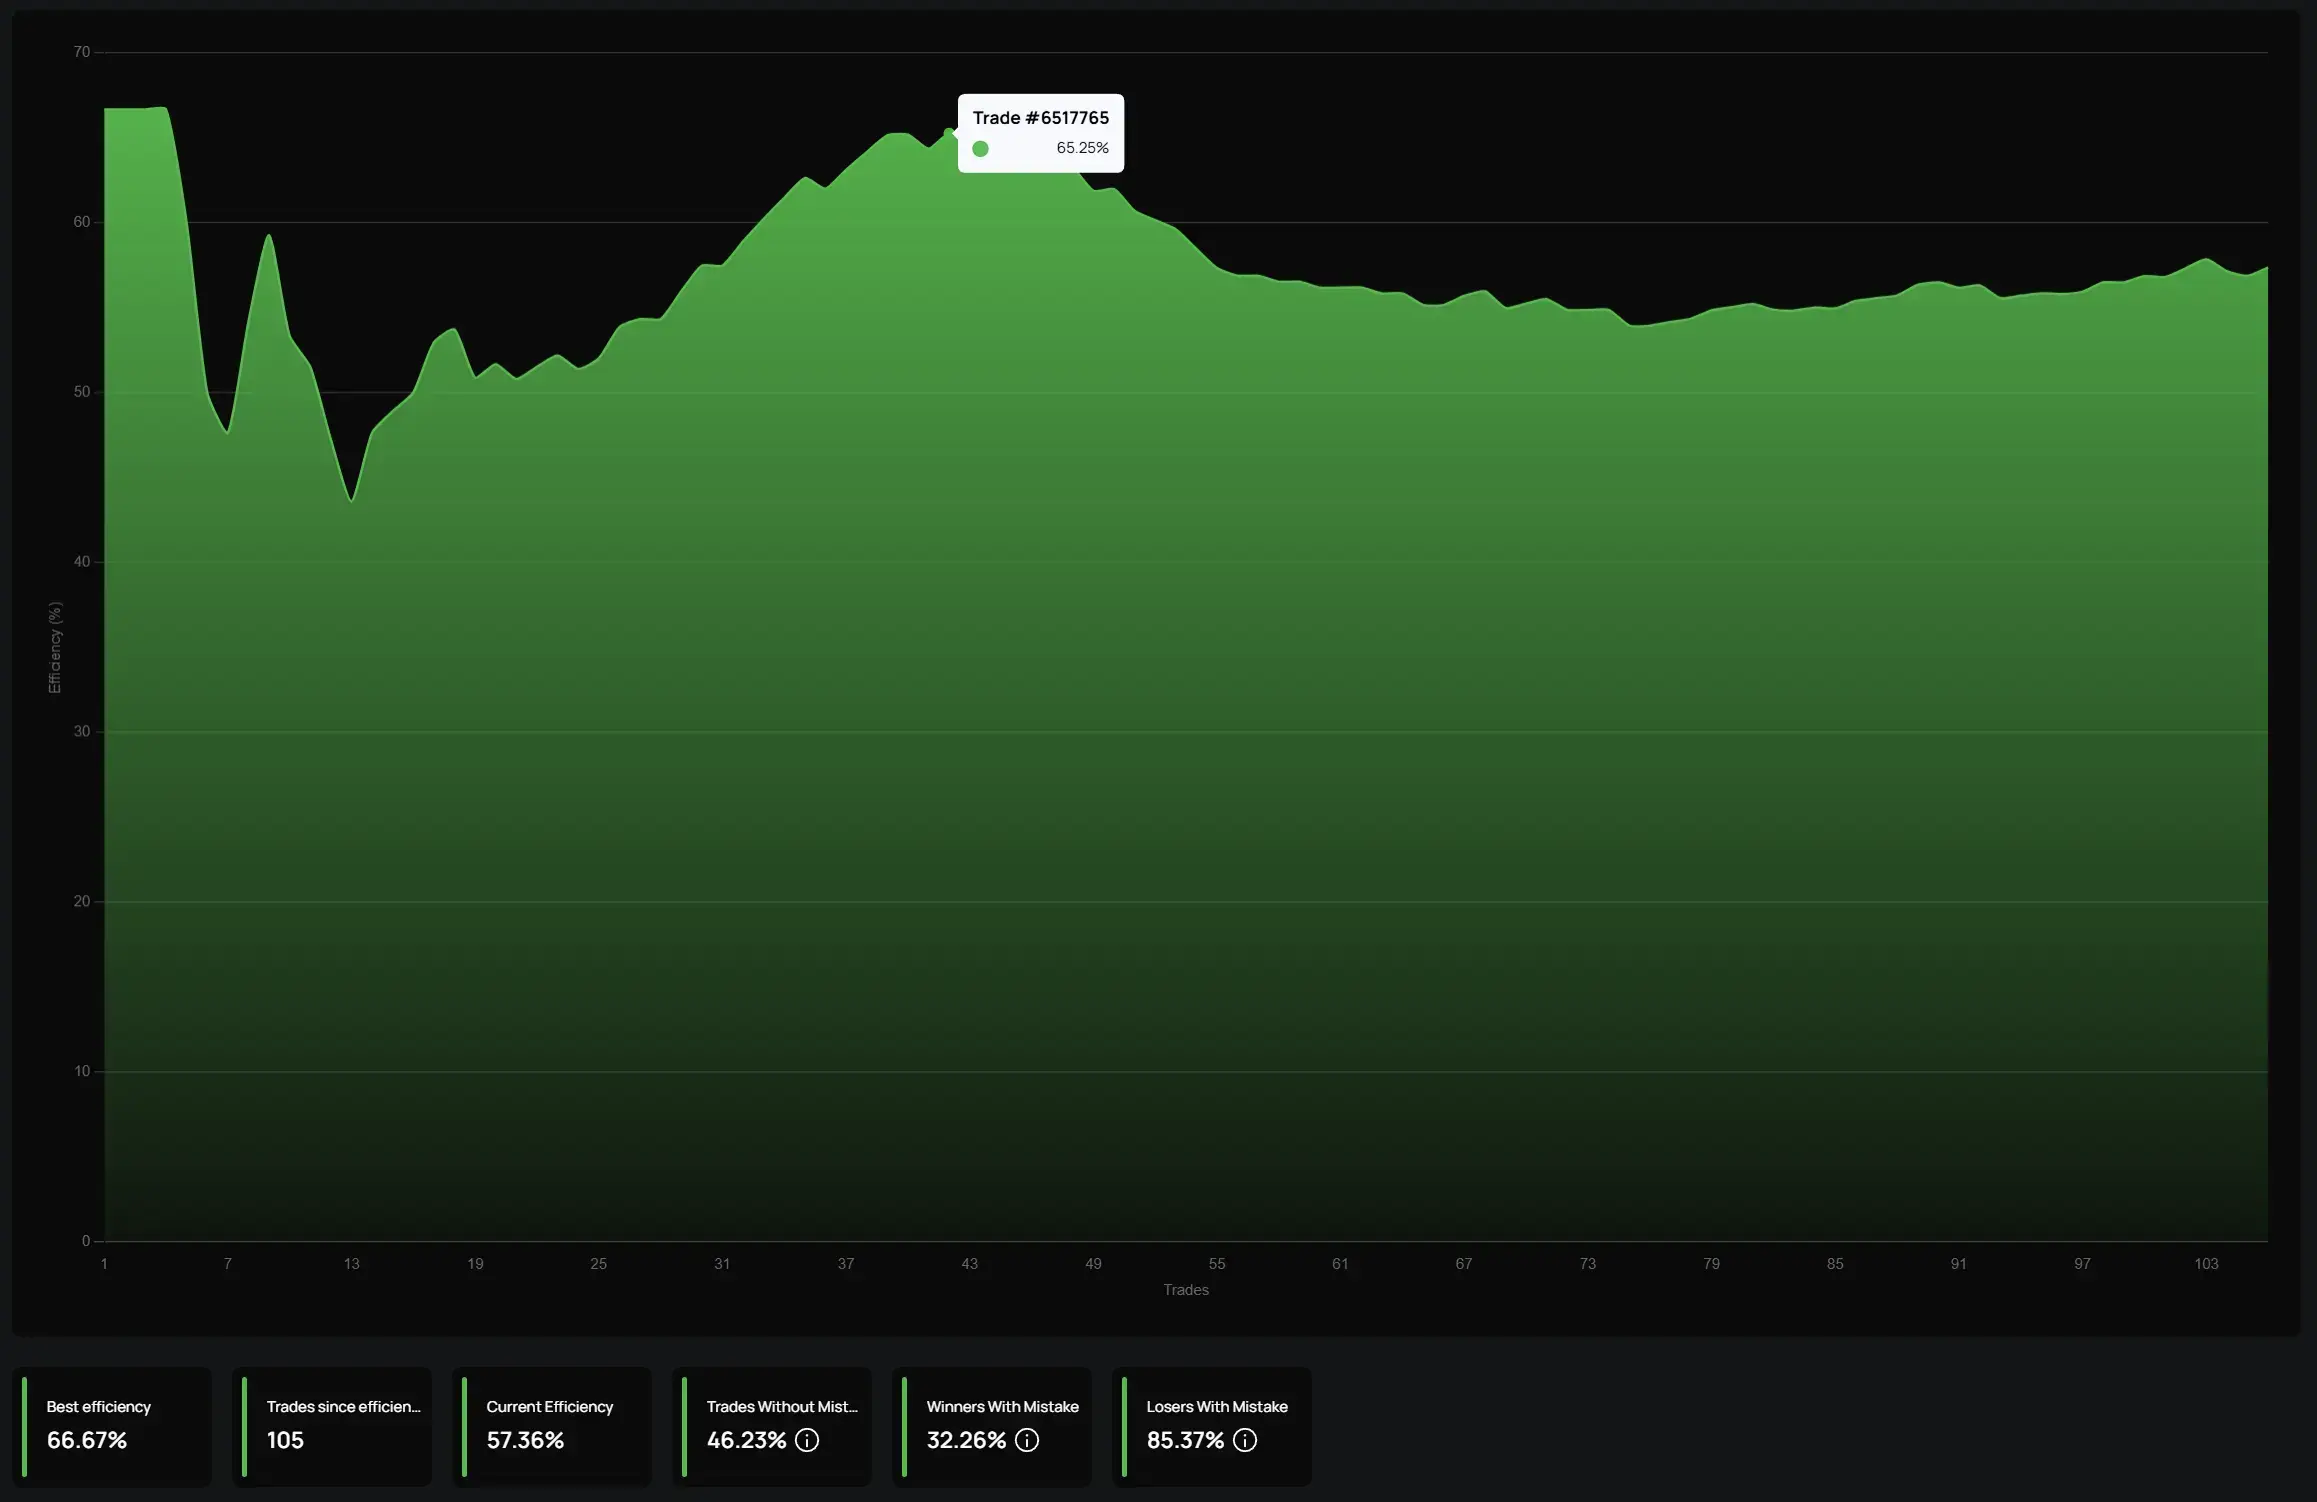
You find Edgewonk's Efficiency analysis under Chart Lab > Efficiency. The graph plots your efficiency over time. The higher the efficiency, the better the trader is following their trading rules.
Trade management involves adjusting stop-loss levels, taking partial profits, and letting winners run. Effective trade management can turn an average strategy into a highly profitable one.
How Edgewonk Tracks It
Edgewonk compares actual trade outcomes to the original take profit and stop loss levels that were set when entering the trade. For many beginning traders, a set-and-forget approach is often more profitable than actively managing trades.
Market conditions fluctuate throughout the day and week. Some trading strategies work better during specific timeframes due to:
How Edgewonk Tracks It
Edgewonk allows traders to filter performance by time of day and day of the week, helping them determine when their strategy performs best.
In Chart Lab > Performance by Time, you can analyze your trading performance based on different timeframes. Swing traders often focus on their performance by weekday, while day traders typically look at which times of day they trade most effectively.
From our experience, many day traders tend to perform best during market open—an insight that can be incredibly valuable for optimizing their approach. By understanding when you trade most profitably, you can fine-tune your strategy and focus on the most effective trading hours.

Exit strategies can make or break a trading plan. Testing different stop-loss and take-profit methods ensures a trader is using the most effective approach.
How Edgewonk Tracks It
Edgewonk helps you test any stop-loss and take-profit strategy you can come up with based on historical trade entries, helping traders find the best approach for maximizing profits while minimizing risk.
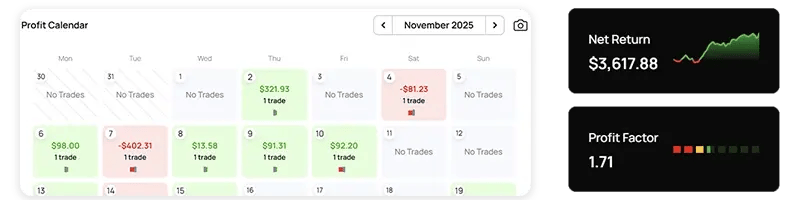
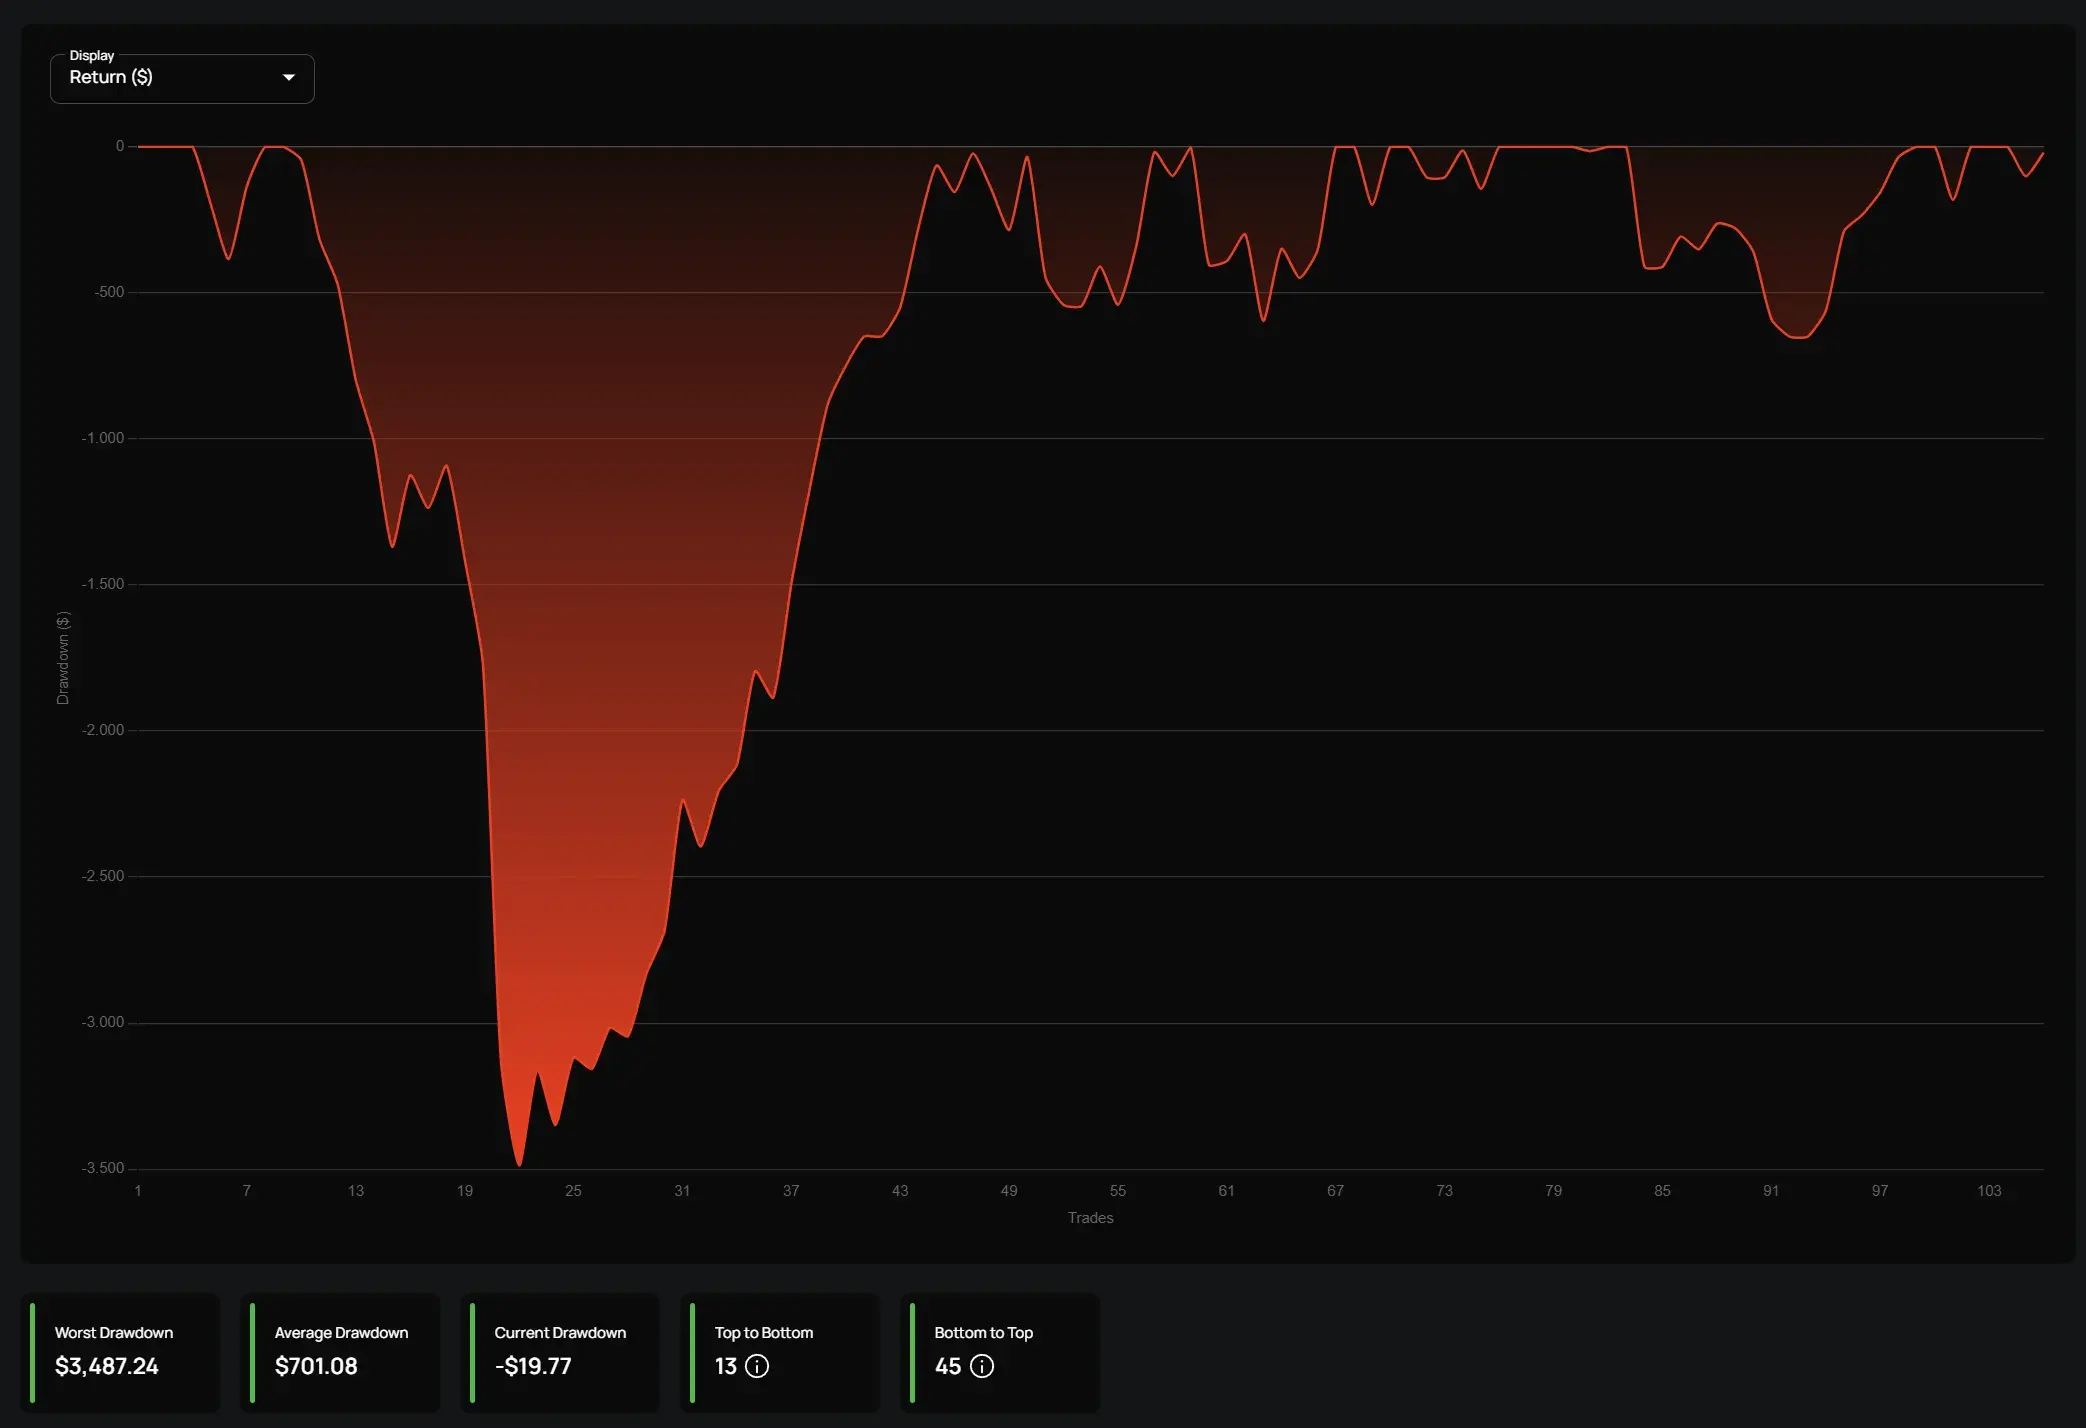
Drawdown measures a trader’s worst-case loss scenario. A high drawdown can indicate excessive risk-taking. The return-drawdown ratio helps determine whether the risk is justified by the returns.
How Edgewonk Tracks It
Edgewonk provides a clear visual representation of your drawdowns, helping you assess risk exposure and evaluate the resilience of your strategy.
In Chart Lab > Drawdown, the line graph illustrates the depth and duration of your drawdowns. The farther the graph moves away from the zero line, the more severe the drawdown. Below the graph, key metrics show how many trades it took to reach your worst drawdown and how long it took to recover—critical insights for managing risk and refining your approach.
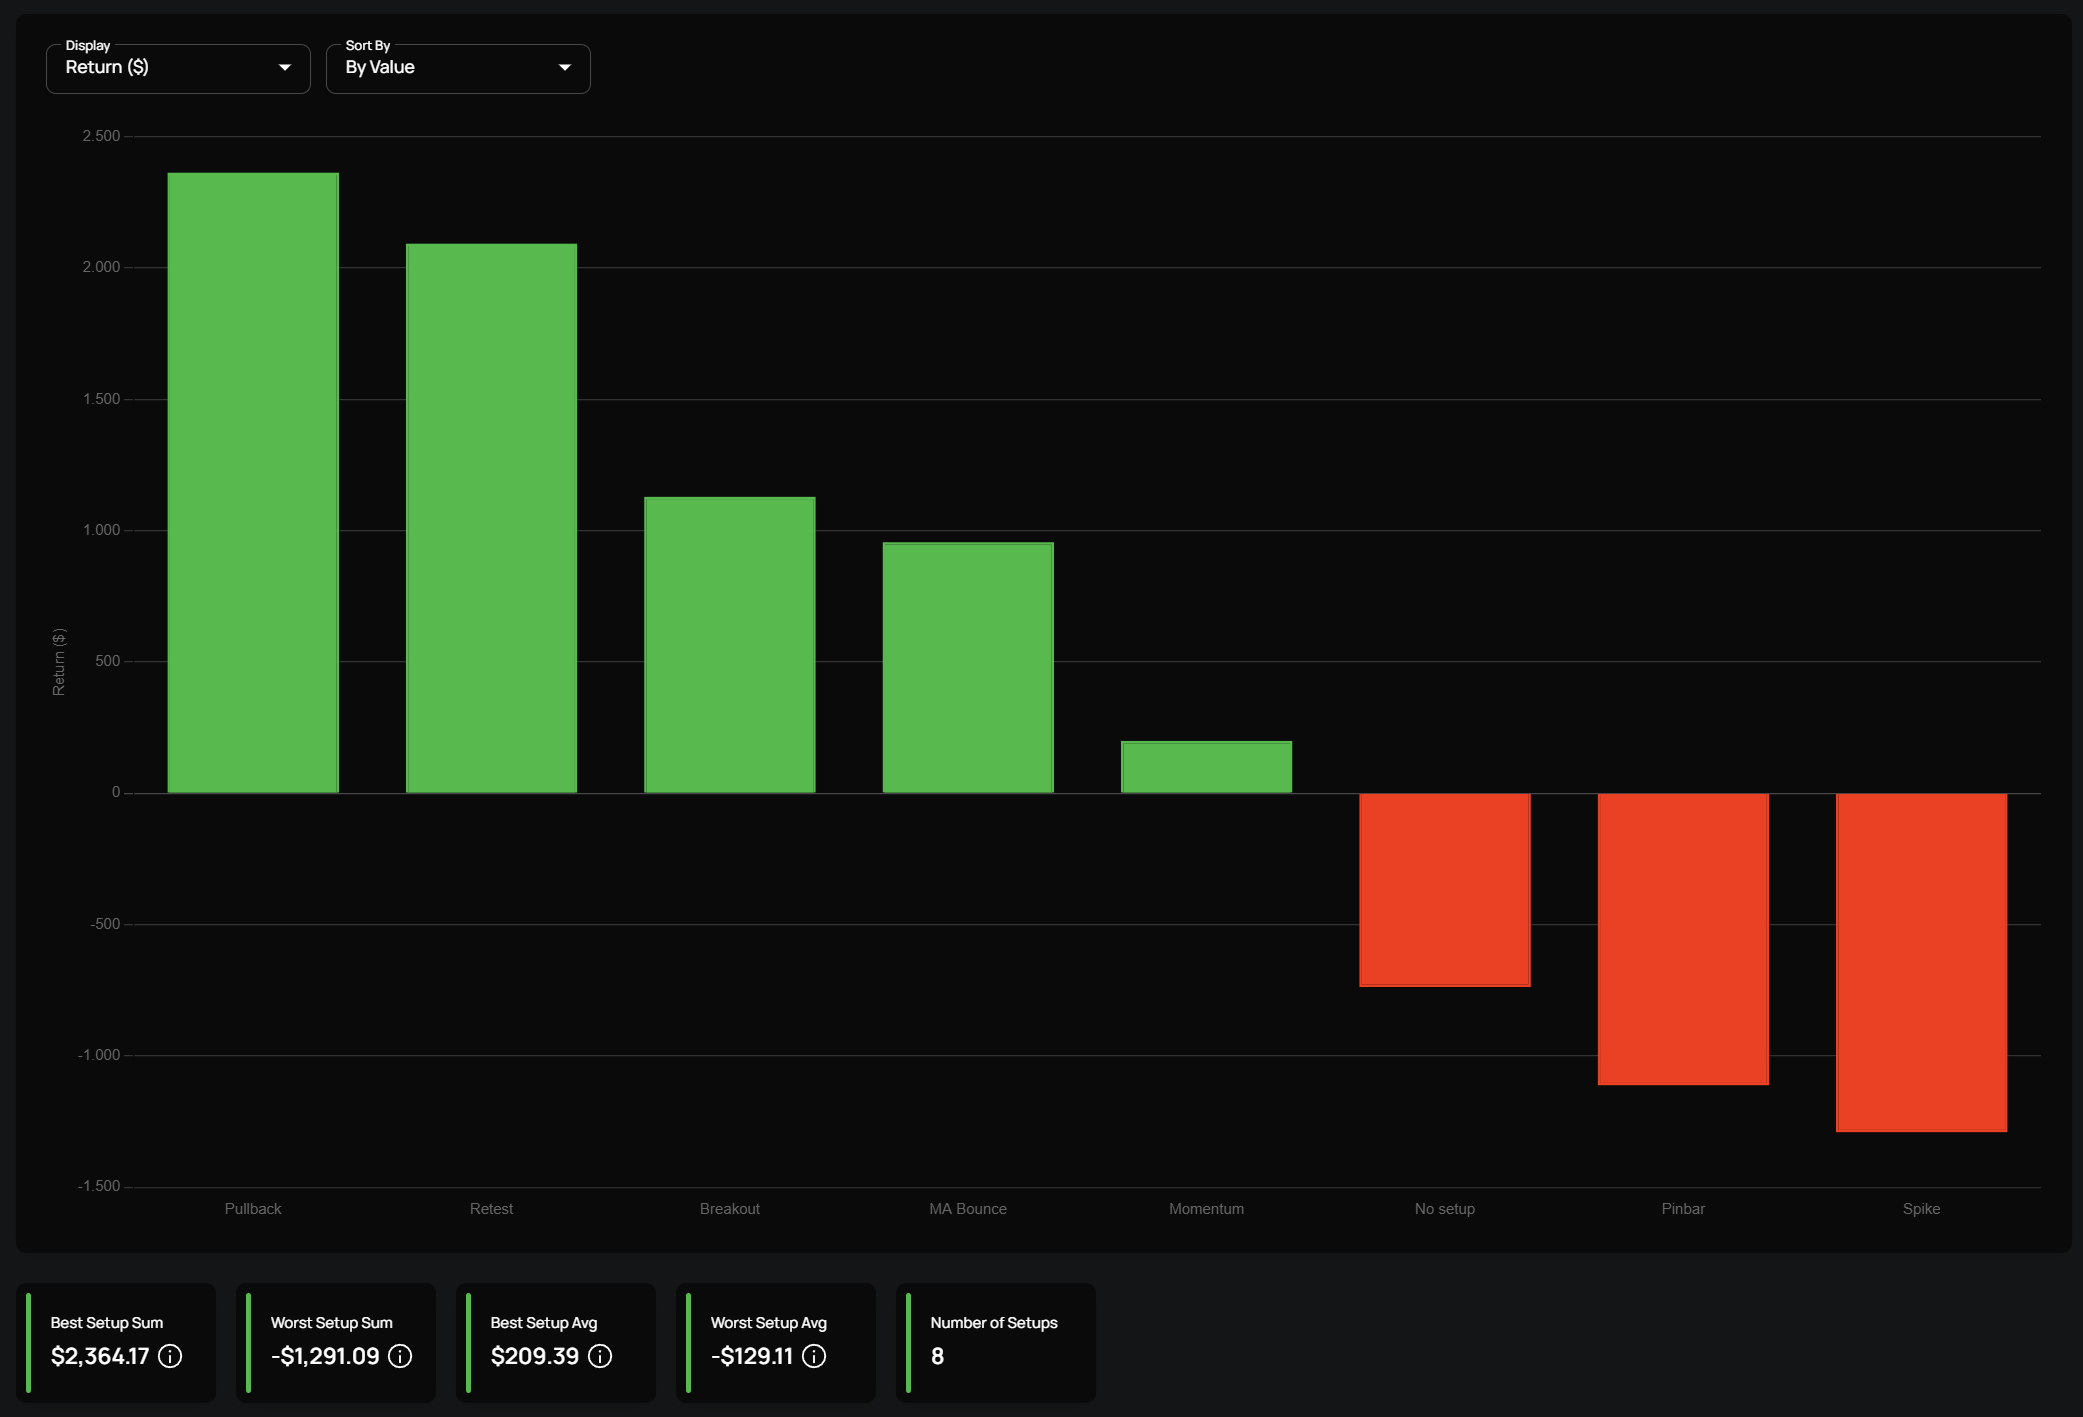
Not all trading setups or instruments (stocks, forex, crypto, futures, etc.) perform equally well. Tracking performance by setup and instrument helps traders refine their focus.
How Edgewonk Tracks It
Edgewonk lets traders tag their trades by setup or instrument type, making it easy to analyze which approaches deliver the best results.
In Chart Lab > Performance by Setup, you get a visual breakdown of how each setup is performing. We often see that struggling traders use too many setups, leading to inconsistency. In the early stages, it’s best to focus on just one or two setups. This streamlined approach helps traders improve faster, minimize mistakes, and reduce unnecessary noise in their trading.
Markets constantly shift between trending, ranging, high-volatility, and low-volatility conditions. A strategy that works well in one market condition may fail in another.
How Edgewonk Tracks It
Edgewonk lets traders label trades by market condition (you can track pretty much anything you want in Edgewonk with the help of the custom statistics), allowing them to identify which strategies work best under different market environments.
Here are a few examples of how other Edgewonk users set up their Custom Statistics:
|
Timeframes |
Chart Confluence |
Market Conditions |
Price Patterns |
Feeling |
Higher Timeframe |
|
Daily |
Support Level |
Index up |
Pinbar |
Rushed |
With the trend |
|
4 H |
Resistance Level |
Index down |
Range breakout |
Prepared well |
Against the trend |
|
1 H |
Round Number |
Volume high |
Fakeout |
Uncertain |
Pullback |
|
15 min |
Supply |
Volume contraction |
Head & Shoulders |
Sick |
Retest |
|
5 min |
Demand |
|
Retest |
|
Neutral |
Emotional trading often leads to poor decision-making, impulsive trades, and deviation from the plan. Understanding the impact of psychology on trading performance helps traders develop discipline.
How Edgewonk Tracks It
Edgewonk includes journaling features where traders can log their emotions, mindset, and decision-making process for each trade. By correlating emotional states with performance, traders can work on improving their psychology.
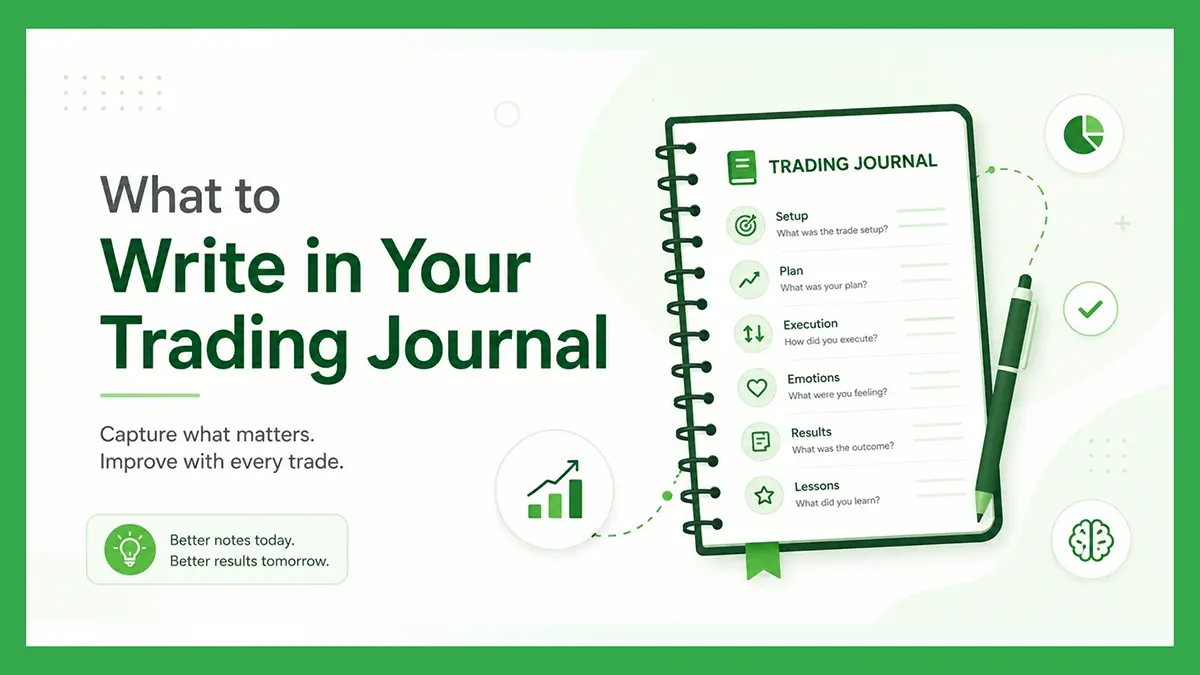
Reviewing past trades visually helps traders refine their entry and exit points. Notes and screenshots provide context, making it easier to spot mistakes and areas for improvement.
How Edgewonk Tracks It
Edgewonk allows traders to upload screenshots, create trading sessions for extensive note taking on a daily, weekly, monthly basis etc., and add trade notes. This makes post-trade analysis more effective and helps traders learn from past experiences. This qualitative aspect of trade reviewing is incredibly important next to the quantitative aspects we have covered.
Tracking key trading metrics is essential for refining strategies, minimizing risk, and improving long-term profitability. Edgewonk simplifies this process by providing structured analytics, visual tools, and performance insights. By consistently reviewing and optimizing these ten metrics, traders can develop a data-driven approach backed by qualitative insights and achieve better trading results.
If you're serious about improving your trading performance, integrating Edgewonk into your routine will give you the insights needed to elevate your strategy and become consistently profitable.
If you want to read more, check out our guide on how to perform an optimal performance review in Edgewonk: read more
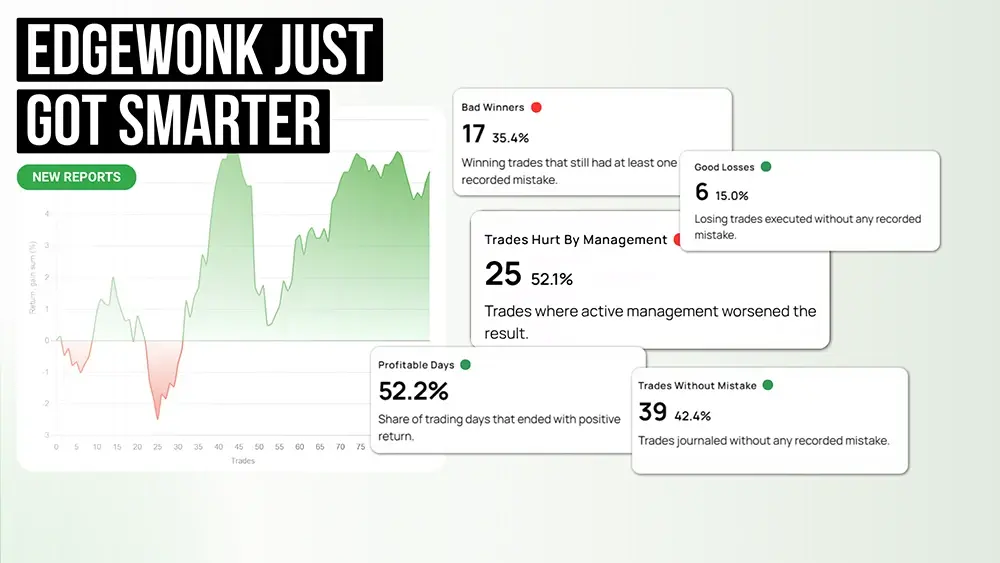
This week, Edgewonk received one major upgrade.
Many traders think of journaling as extra admin work after the trade is already over. But a good trading journal is not just a place where you store...
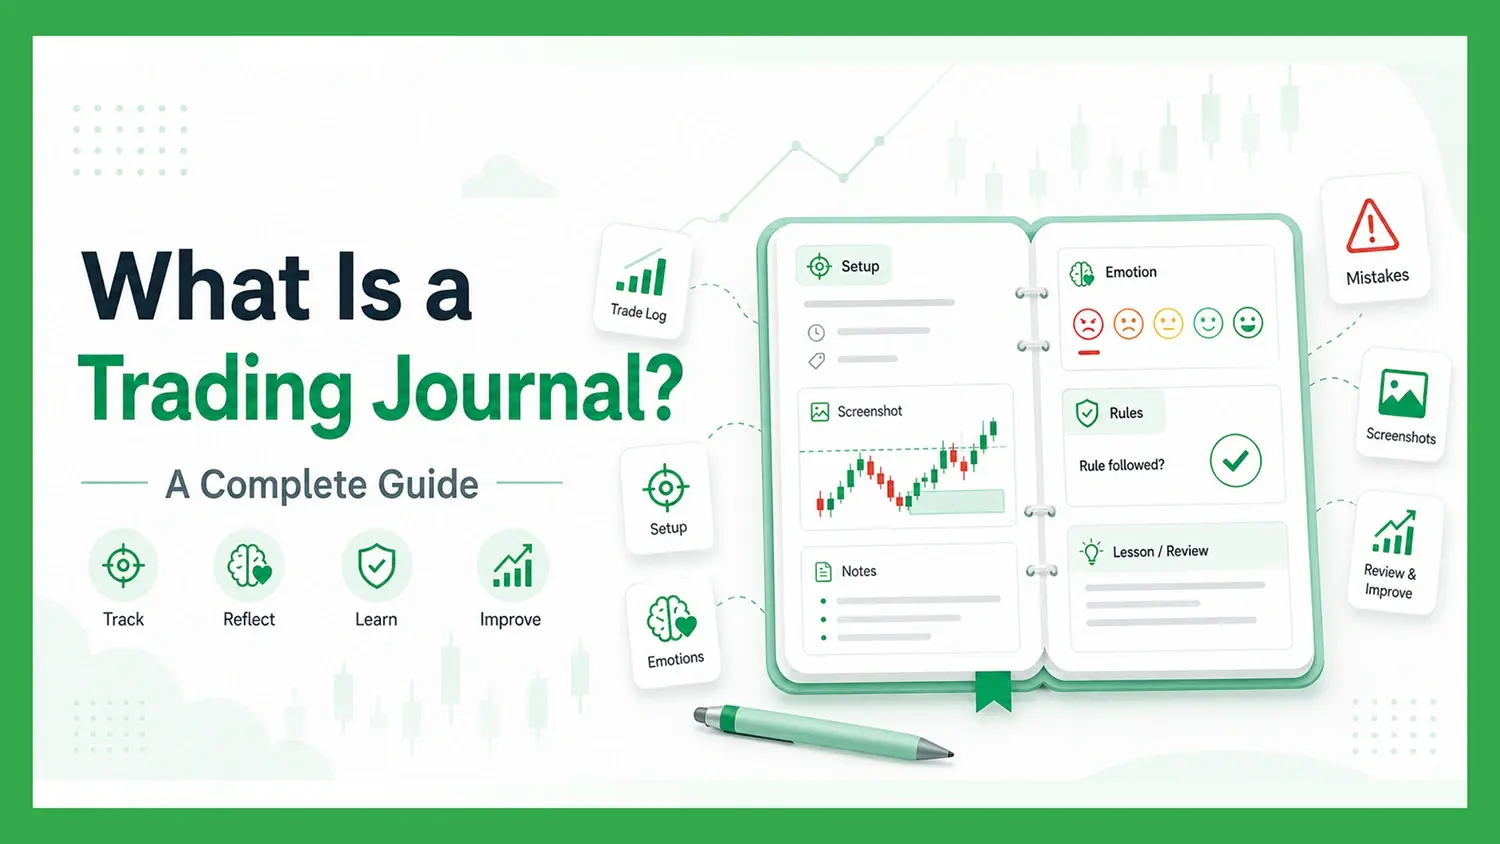
A trading journal is one of the most important tools a trader can use to improve their performance. It helps you record your trades, review your...