

 For New Traders
 For Breakeven Traders
 For Profitable Traders
Edgewonk Adds Deeper Trading Analytics to Chart Lab
This week, Edgewonk received one major upgrade.
4 min read
.png)
In trading, consistent performance reviews are the key to long-term success. Edgewonk offers a comprehensive set of tools that allow traders to analyze and improve their trading strategies systematically.
In this guide, we will walk you through the key features of Edgewonk that help you review your trading performance effectively. Whether you're assessing how well you follow your trading rules, identifying underperforming strategies, or fine-tuning your risk management, this guide will provide you with actionable insights.
If you’ve been looking for a way to take your trading to the next level, this guide will equip you with the knowledge and tools to make data-driven improvements and achieve more consistent results in your trading.
The first step in performance analysis is evaluating how well you follow your trading rules. Even the best trading strategy won't be profitable if you can't consistently stick to its guidelines.
Edgewonk offers several tools to help traders assess how well they are executing their trades:
Tiltmeter: In the Journal tab, the Tiltmeter column visually represents how closely you're following your trading plan. A red Tiltmeter indicates frequent rule violations, while a green Tiltmeter shows that you're adhering to your rules.
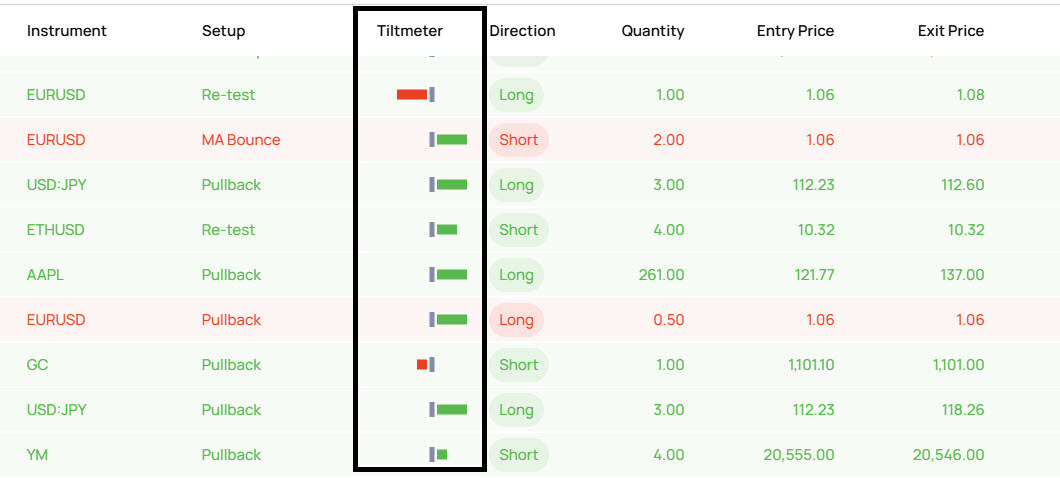
Chart Lab > Trade Comments: The Trade Comments bar graphs show how much you're gaining or losing based on the comments you've used for each trade in Edgewonk. For each trade, you can rate the quality of your entry, exit, and trade management. This graph breaks down your performance across different trading decisions, helping you identify your strengths and weaknesses.
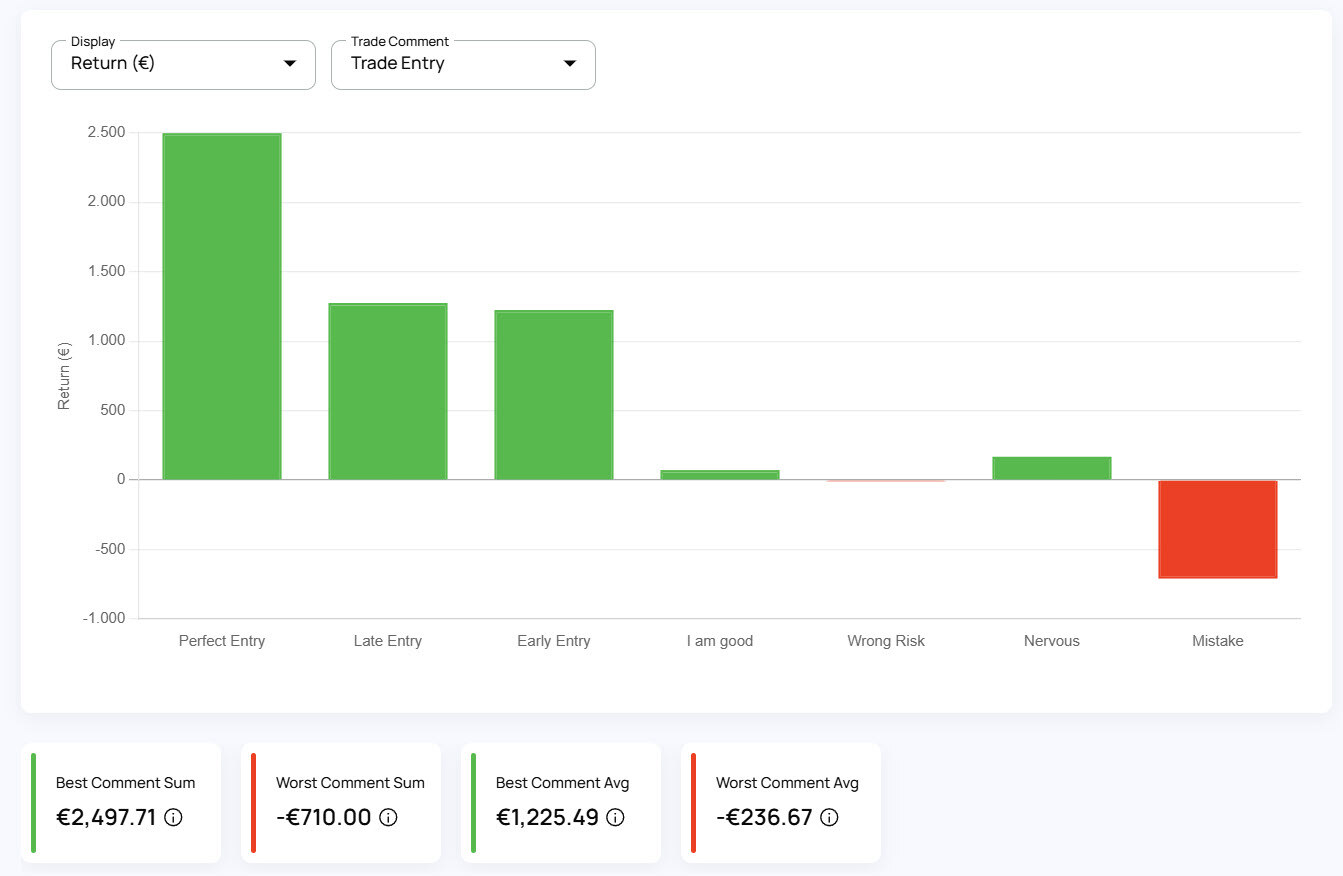
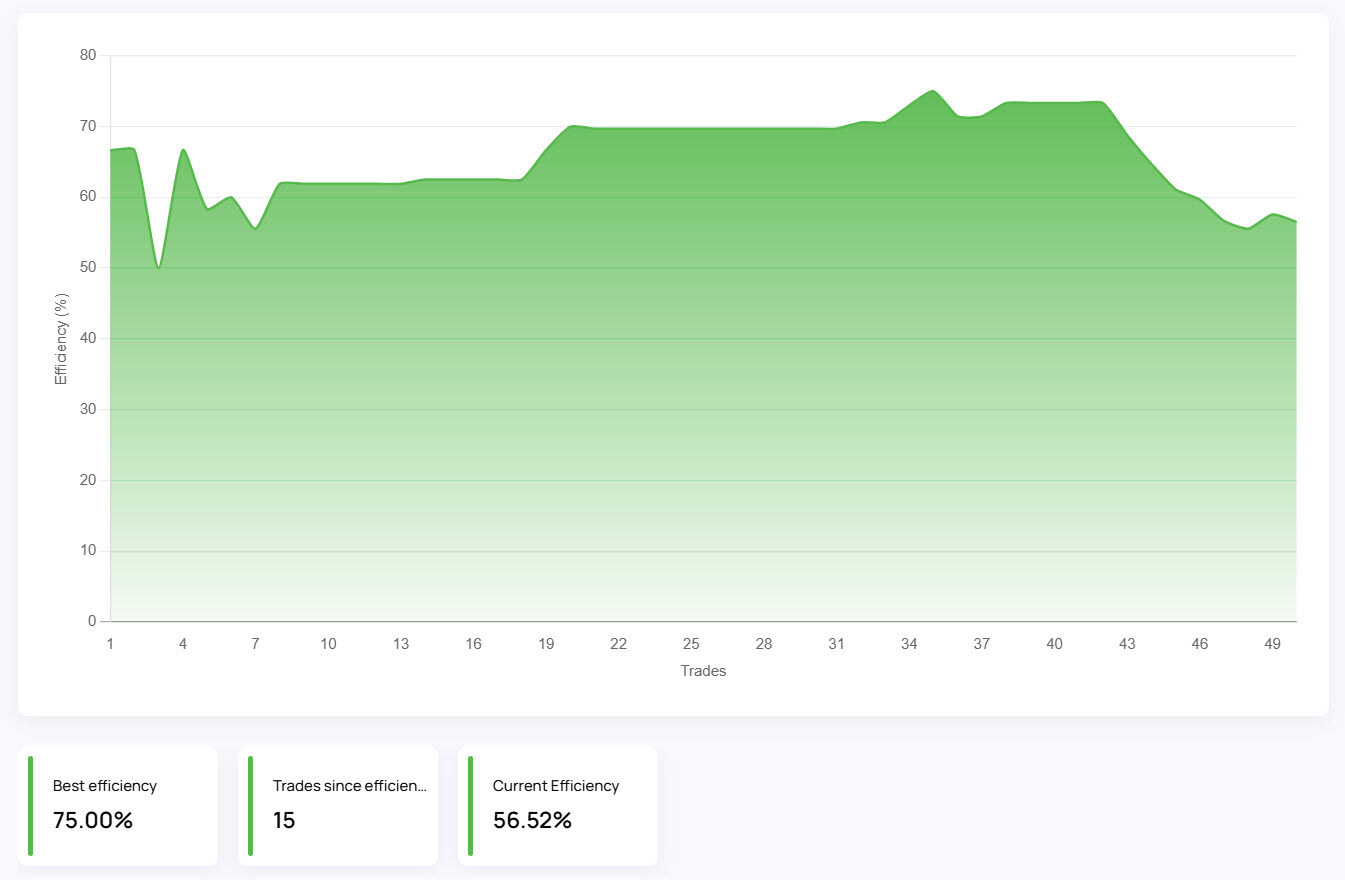
Chart Lab > Efficiency: The Efficiency graph measures the quality of your trading decisions. A higher efficiency score means you're following your rules more consistently, while a drop in efficiency suggests you've been breaking your rules more frequently.
Next, identifying underperformers can help you address areas in your trading where you're losing the most money. Overperformers, on the other hand, are your strengths and you should leverage those. Focusing on these outliers can lead to significant improvements in your overall performance.
Chart Lab > Performance by Setup: This graph highlights the profitability of each of your trading strategies. If you identify an underperforming strategy, you have two options: either stop trading it altogether or use other Edgewonk features to improve its performance.
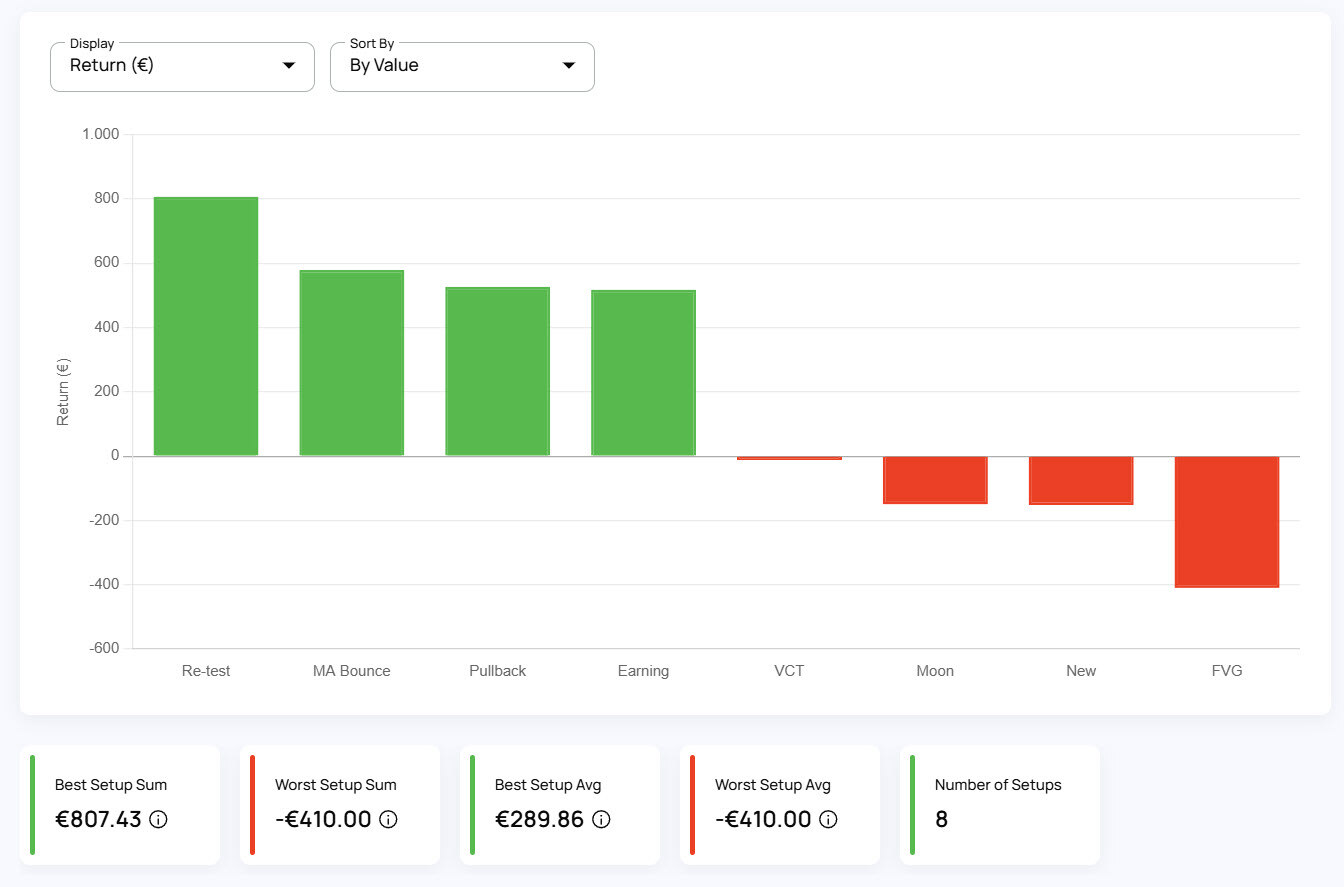
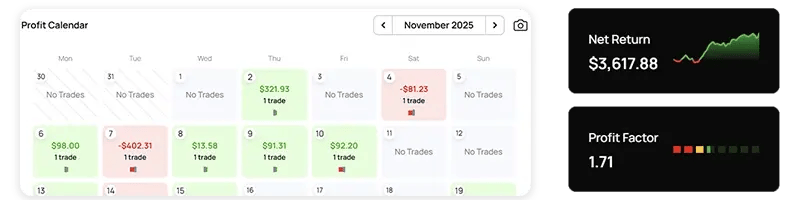
Chart Lab > Performance by Time: This graph reveals your most and least profitable trading days and hours. For example, many traders struggle on specific weekdays, like Mondays. Underperformance on Mondays could suggest that you haven’t adequately prepared for the week or that weekend events have caused increased volatility, leading to more stop-outs.
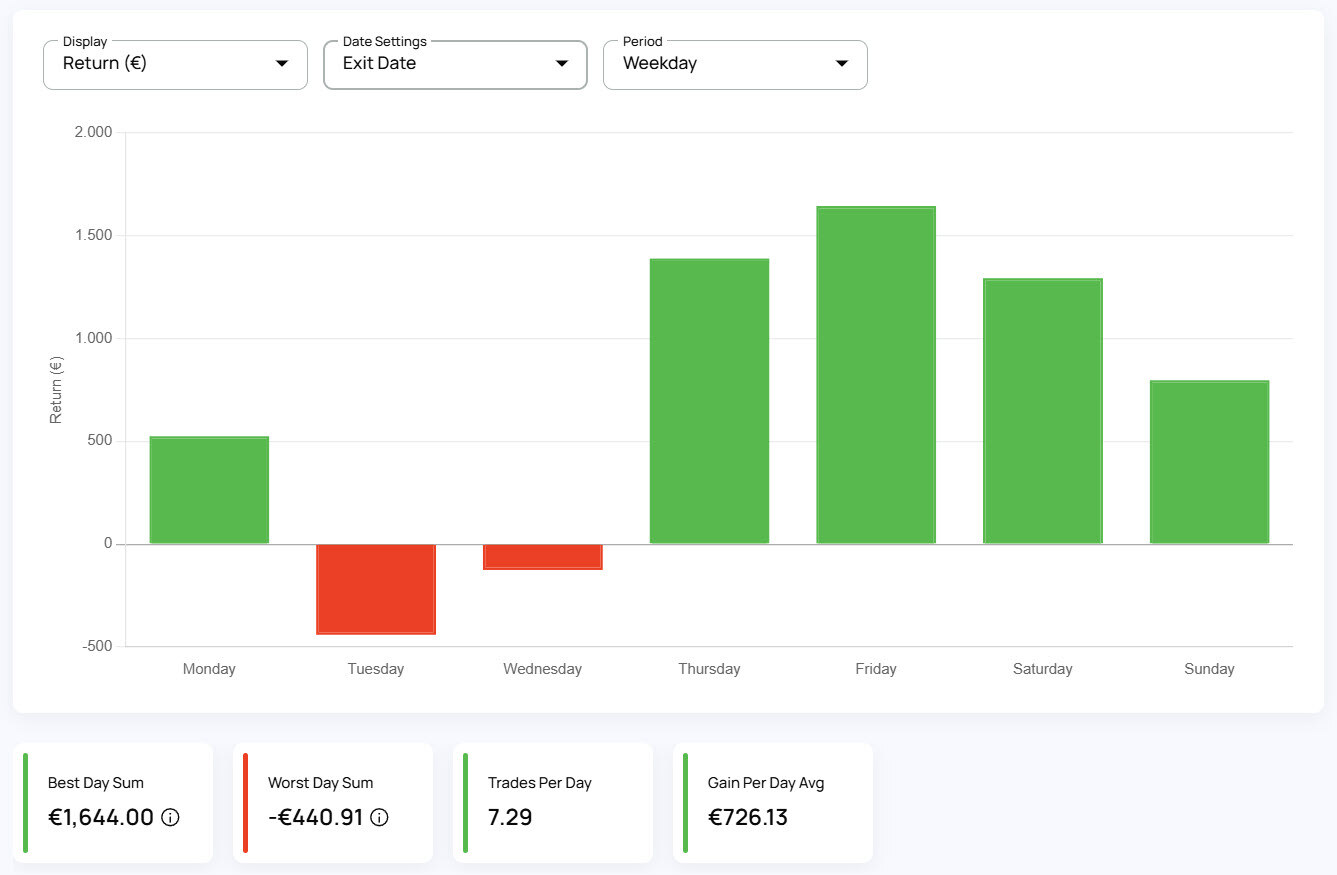
Day traders might also notice patterns throughout the trading day, such as stronger performance during market open volatility and weaker results later in the day. Recognizing these patterns helps you adjust your strategy to the times when you're most effective.
Chart Lab > Performance by Instrument: If you're underperforming with a particular instrument, it could indicate that your trading strategy isn't well-suited to that instrument's characteristics. Different instruments have unique levels of volatility, momentum, and active trading times. Adapting your strategy and parameters to match these features can help improve your performance.
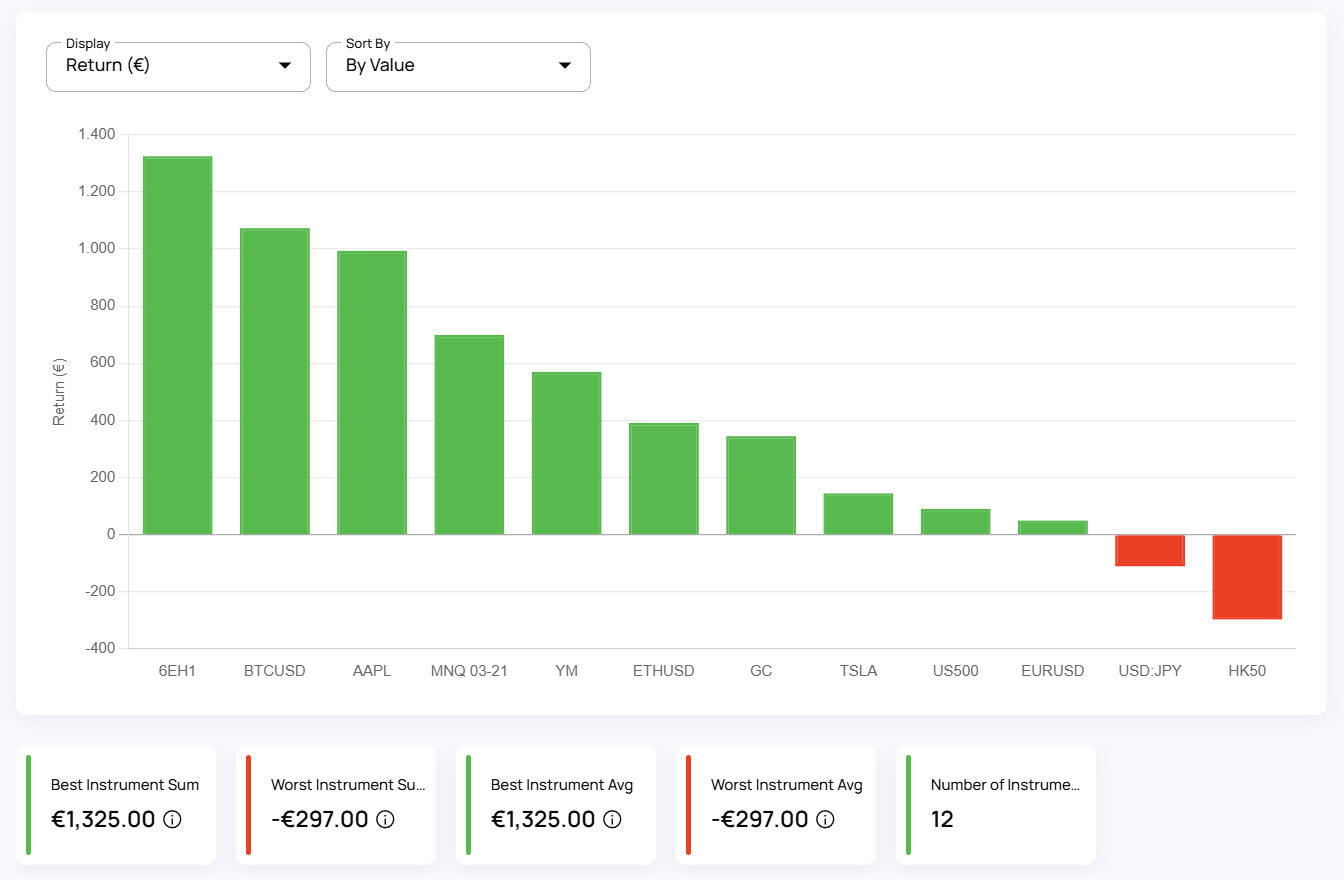
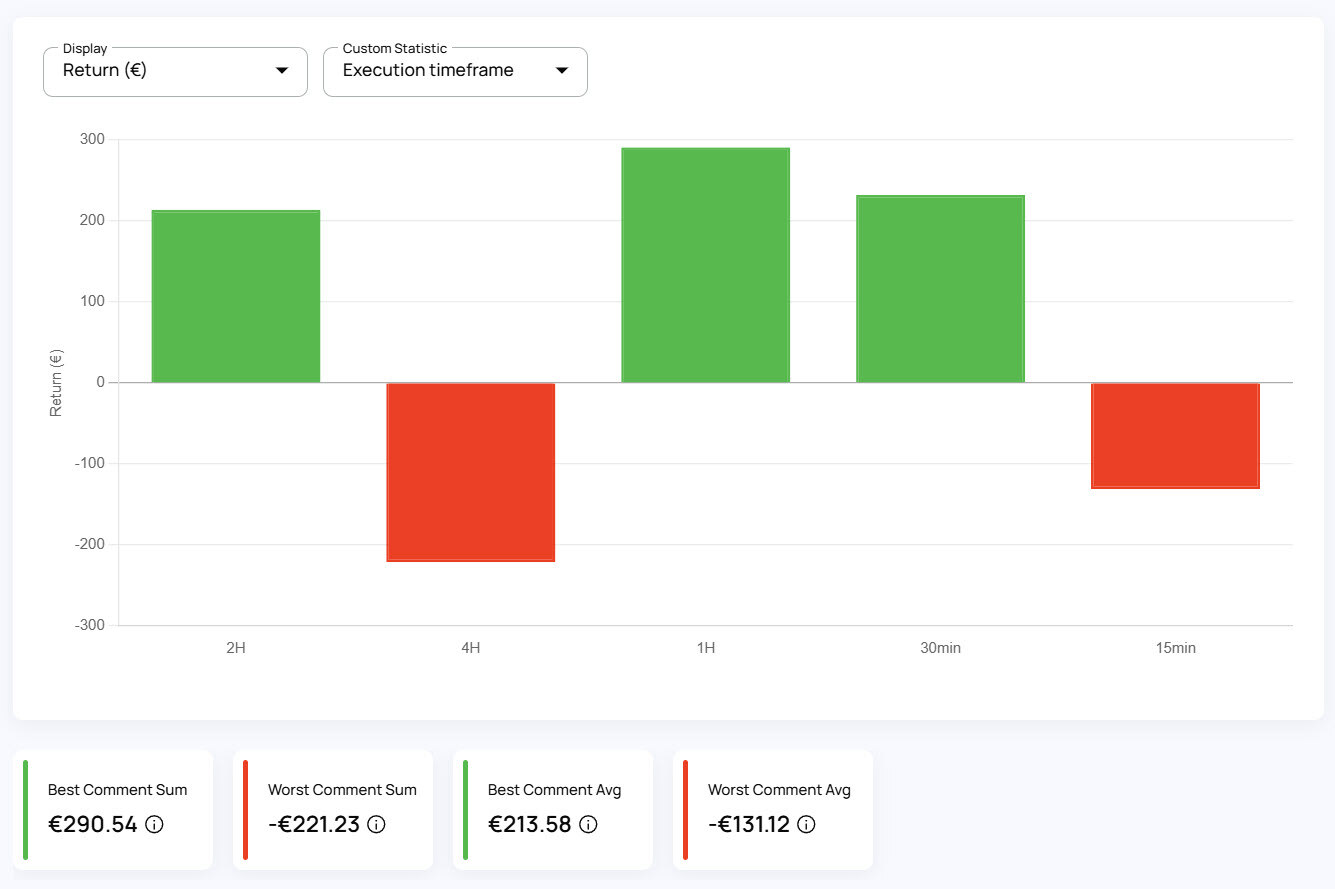
Chart Lab > Custom Statistics: In Edgewonk, you can create up to 20 unique tags to categorize your trades. You might track factors like timeframe, chart patterns, market direction, mental state, or indicator values. The Custom Statistics graph then allows you to see which tags perform best and worst. The goal is to capitalize on your strengths while improving or avoiding the areas where you consistently underperform.
Now, let’s focus on the overall profitability and risk management aspects of your trading approach. Risk management is crucial because even the most promising strategy can lead to losses if you don’t follow sound risk management principles.
Here’s how Edgewonk can help you monitor and improve your risk management:
Chart Lab > Risk Distribution: This graph displays the frequency of your trading results, grouped into different intervals. High bars indicate that more trades fall within a specific interval. Pay special attention to negative outliers. While most bars will cluster around the middle, red bars on the far left represent large losing trades. If you notice an increased number of red bars to the left, it could indicate that you're breaking your risk management or position sizing rules, leading to significant losses.

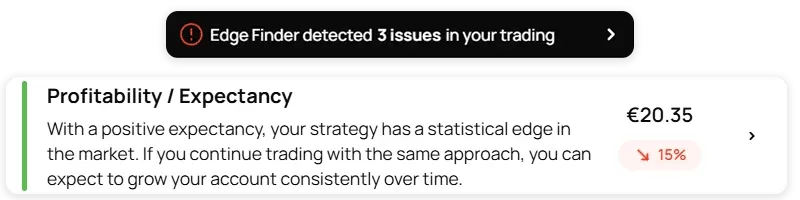
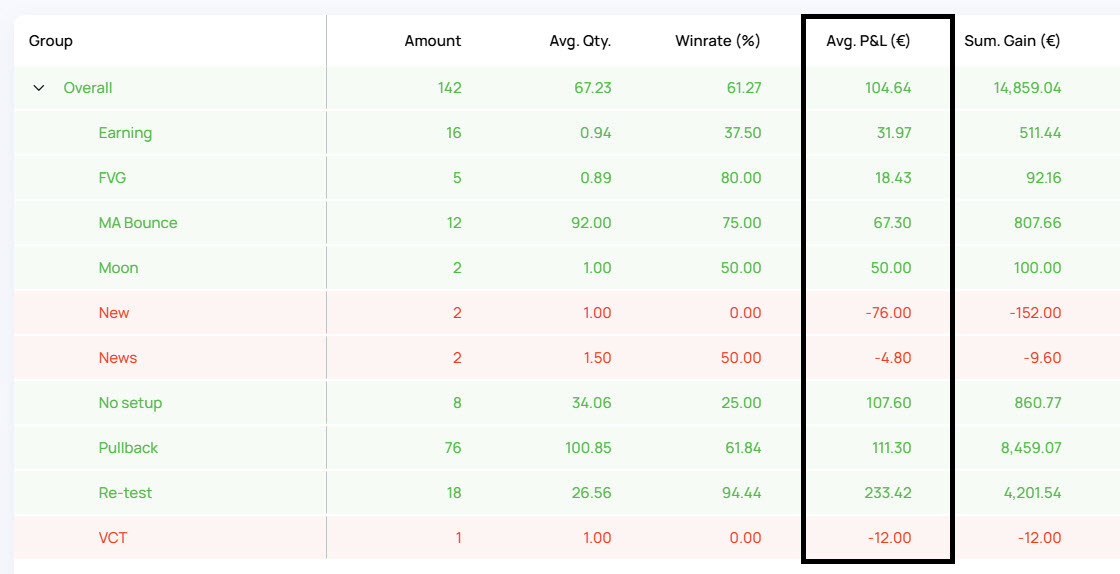
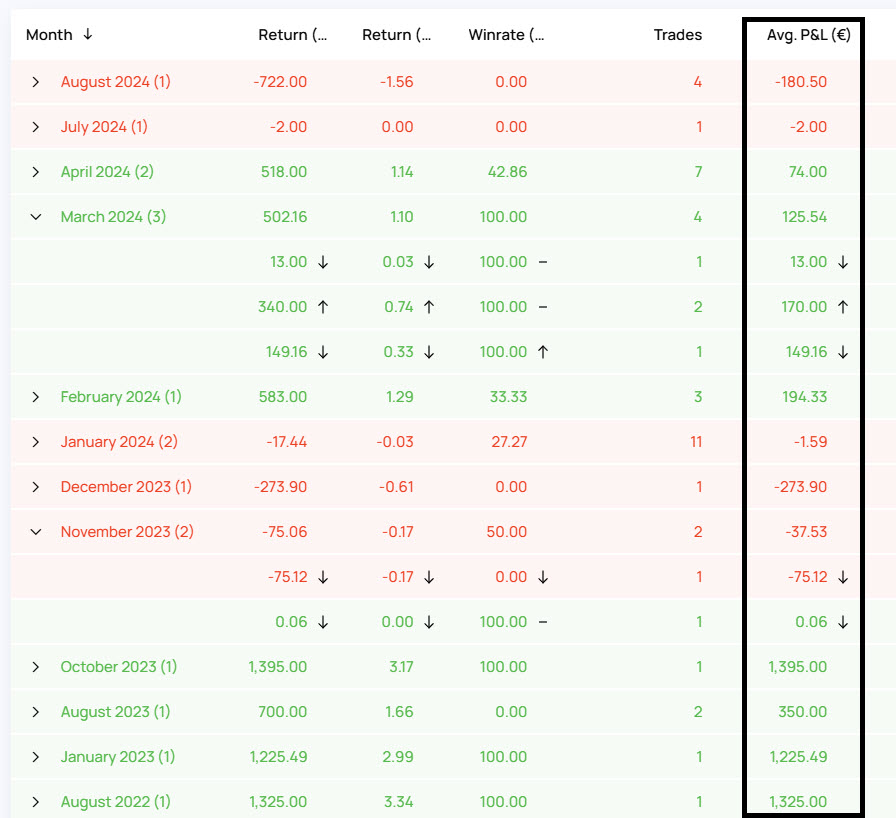
Avg P&L: The average profit and loss (Avg P&L) represents the average value per trade. The higher this value, the more your winners outweigh your losses. Underperforming or losing strategies typically have a low Avg P&L. You can find the Avg P&L in various areas of your Edgewonk journal, allowing you to identify the most and least profitable parts of your trading:

Many traders leave money on the table by mismanaging their trades. This often happens when they close winning trades too early or move their stop losses too aggressively, leading to stop-outs just before the price turns in their favor.
Chart Lab > Trade Management: The Trade Management graph evaluates how effectively you manage your trades. When the green line (potential performance) is above the blue line (actual performance), it suggests that you could have made more money by letting your trades run without interference.

The Trade Management analysis in Edgewonk compares your realized performance to a "set-and-forget" approach. Ideally, the blue line should be above the green line, indicating that your active trade management is adding value. If not, leaving your trades alone might have resulted in better performance.
Chart Lab > Exit Analysis: In the Exit Analysis tab, each trade is represented by a green and red vertical bar. The green part shows how much the price moved in your favor and how close it came to hitting your profit target (green horizontal line). The red part shows how much the price moved against you and how close it came to hitting your stop loss (red horizontal line).
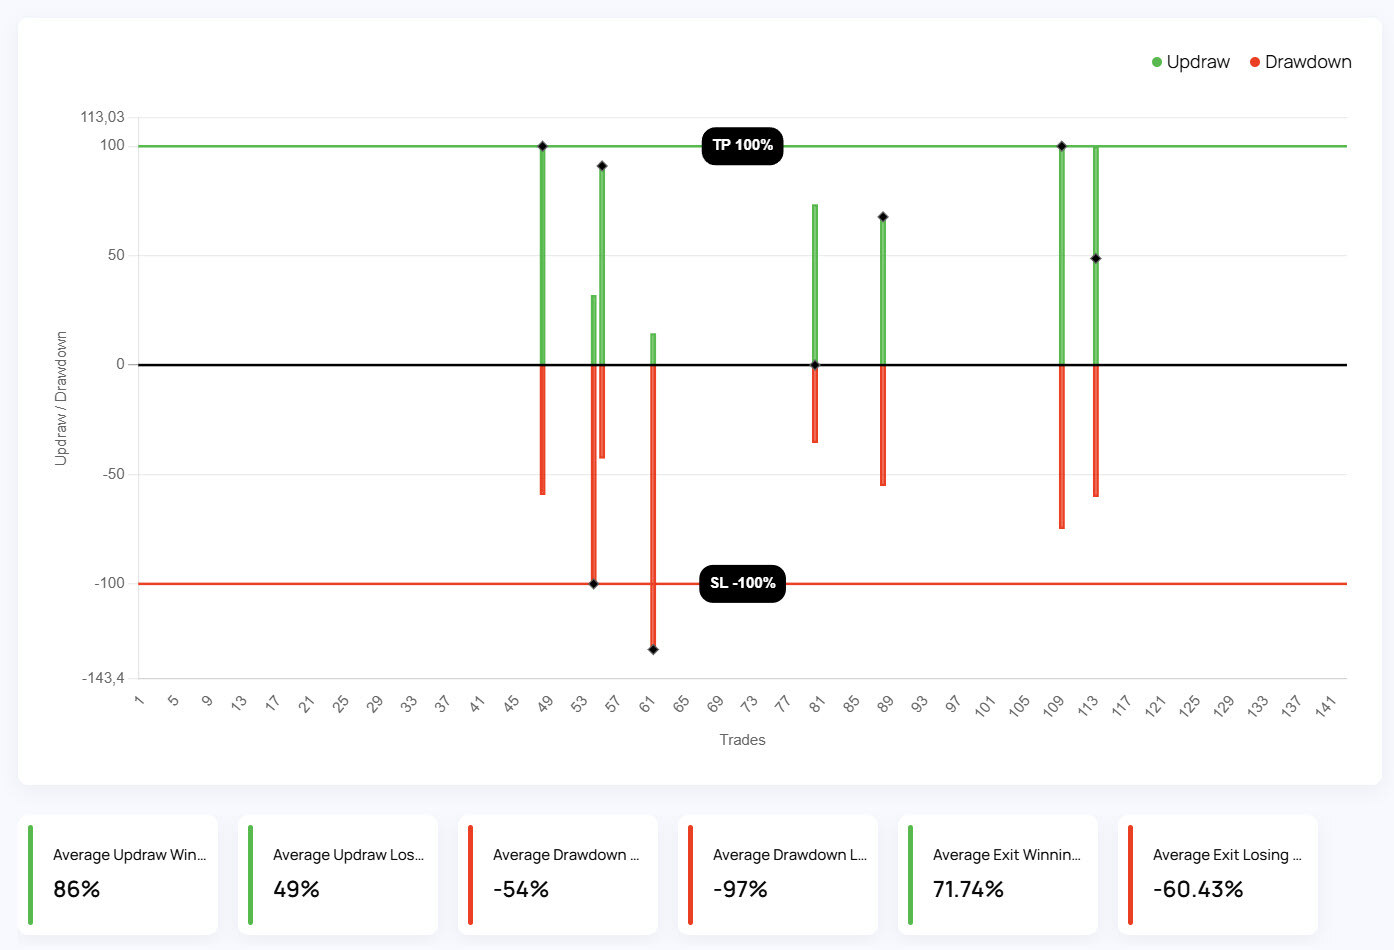
Here are a few scenarios to watch for:
We regularly review our customers' trading journals, helping them interpret their performance data and develop effective plans to improve their trading. By analyzing their trades, we guide them on how to move forward most efficiently.
Our review videos are designed to further enhance your understanding of Edgewonk's features and help you create a personalized review process that works best for you.
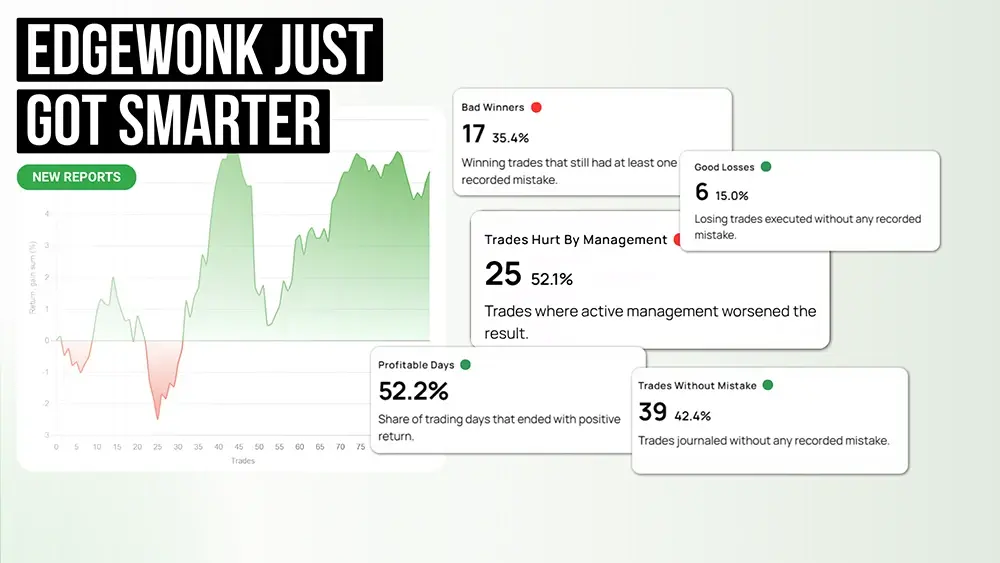
This week, Edgewonk received one major upgrade.
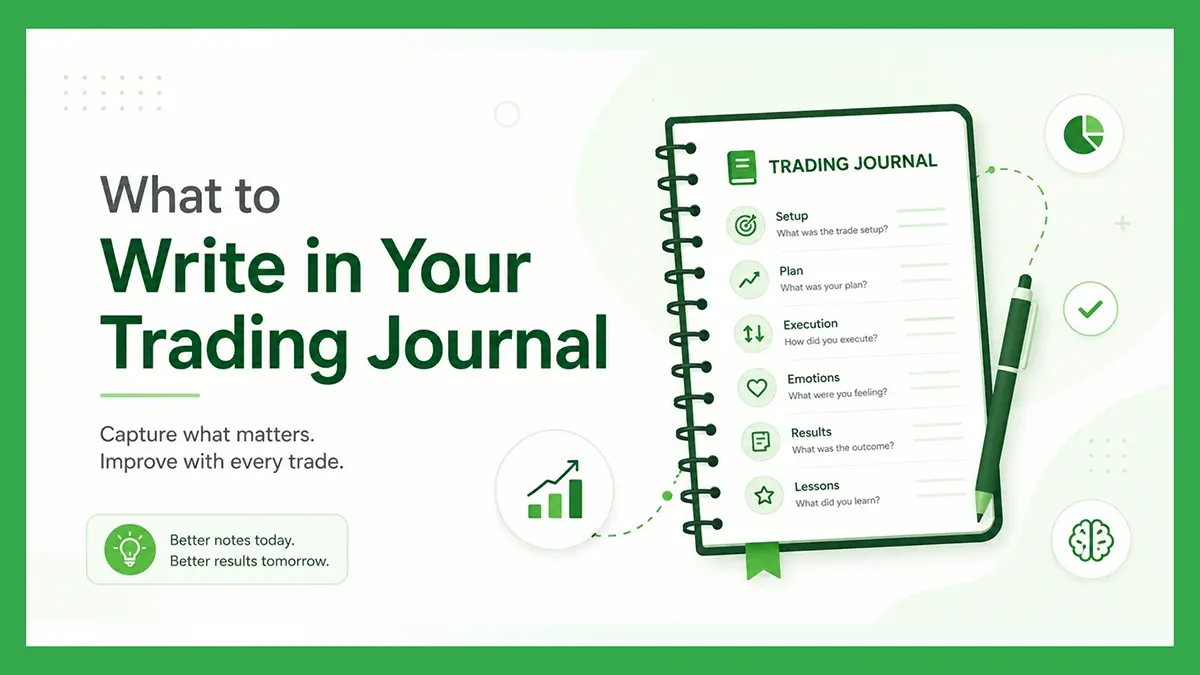
Many traders think of journaling as extra admin work after the trade is already over. But a good trading journal is not just a place where you store...
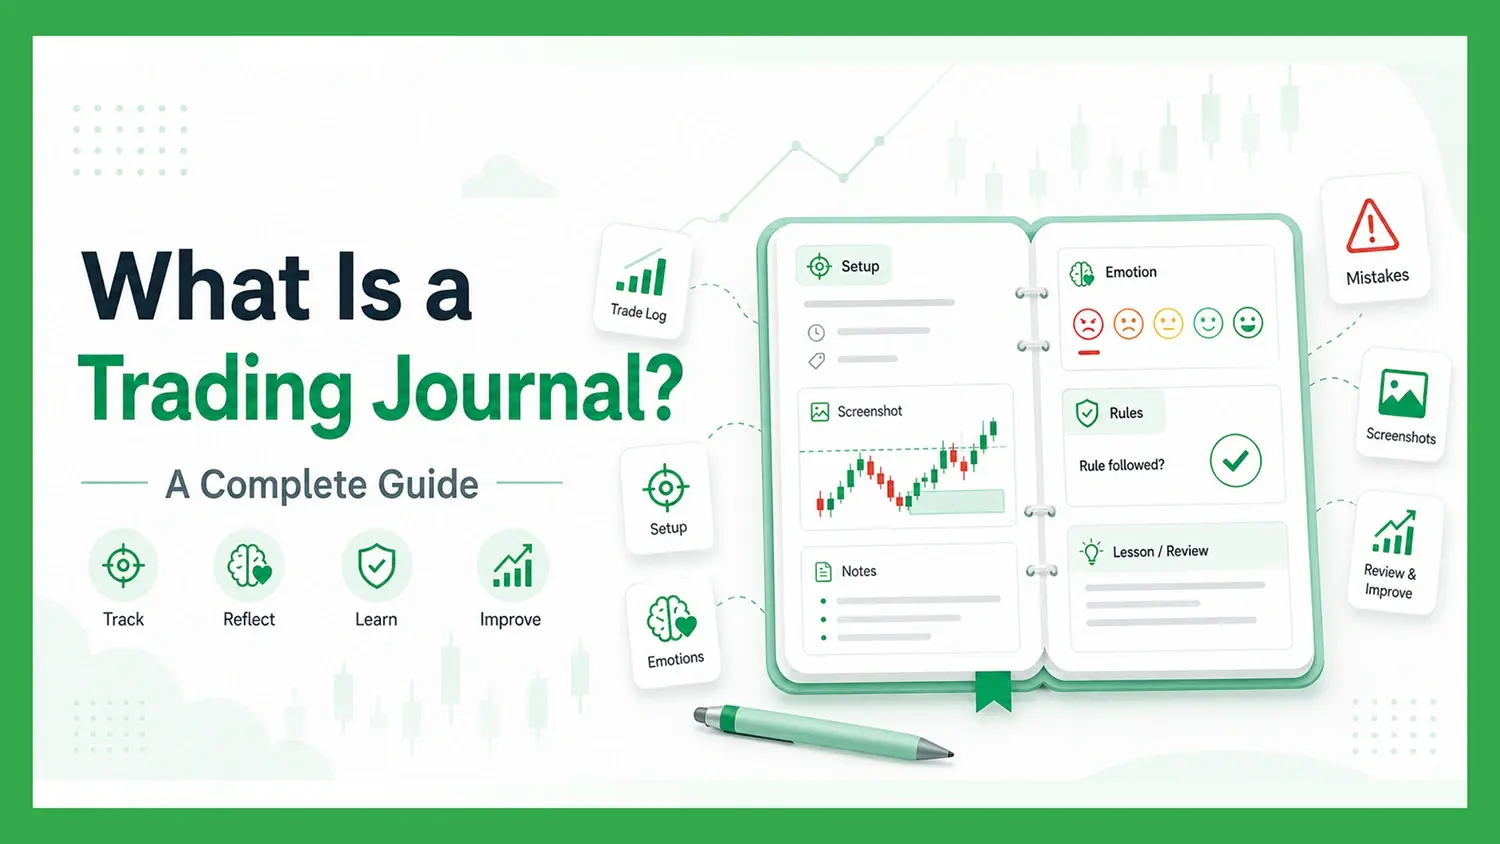
A trading journal is one of the most important tools a trader can use to improve their performance. It helps you record your trades, review your...