Ever stared at your Edgewonk trading journal, brimming with data, and wondered what it all means? You're not alone. Tracking performance statistics is crucial for any trader, but deciphering those numbers can be a challenge. Fear not!
In this comprehensive guide, we will unlock the importance of each metric, ratio, and statistic in your Edgewonk trading journal. We'll break down the calculations, explain what the numbers tell you about your trading, and equip you with the knowledge to transform your journal into a powerful tool for trading success.
Sharpen your trading pencils and prepare to become fluent in the language of your performance metrics!
Return
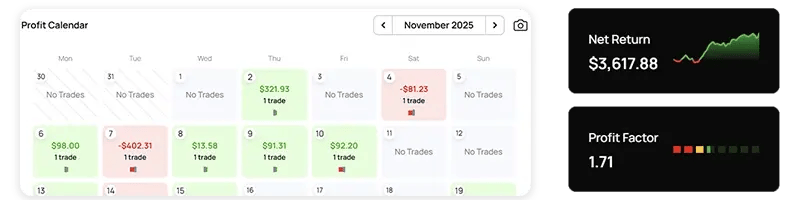
The Net Return shown in the top left widget provides the cumulative return of all trades and in other areas of your Edgewonk trading journal. Looking at the example below, the first trade generated a profit of 10%, and the second trade 9.09%. The individual trade return is calculated based on the account balance at the time of the trade. Adding the two numbers, the net return is 19.09%.
This is different from the ROI as we will see now:
|
|
|
Return
|
New account balance
|
|
Initial deposit
|
100 USD
|
|
100 USD
|
|
Trade 1 profit
|
10 USD
|
10 %
|
110 USD
|
|
Trade 2 profit
|
10 USD
|
9.09 %
|
120 USD
|
|
Return Sum
|
|
19.09 %
|
|
Edgewonk also provides the return in terms of account currency. In such cases, we sum up the individual returns of each trade as well.
ROI
ROI stands for return on investment. When we come back to the example above, the account has an initial deposit of 100 USD, and the two trades generated a total profit of 20 USD. The ROI is, therefore, 20%.
Although the net return and the ROI are often close, they are not identical:
|
|
Initial deposit
|
Current account balance
|
ROI
|
|
Journal 1
|
100 USD
|
150 USD
|
50%
|
|
Journal 2
|
100 USD
|
200 USD
|
100%
|
|
Journal 3
|
200 USD
|
150 USD
|
-25%
|
Avg P&L
The Avg P&L shows the average per-trade value. Assuming a trading journal has 10 trades with a total return of 1500 USD, the Avg P&L is going to be 150 USD. You take the total return and divide it by the number of trades.
In Edgewonk, Avg P&L is sometimes called Expectancy as well:
|
|
Total return
|
Number of trades
|
Avg P&L
|
|
Journal 1
|
1000 USD
|
10
|
100 USD
|
|
Journal 2
|
1000 USD
|
25
|
40 USD
|
|
Journal 3
|
1000 USD
|
50
|
20 USD
|
Profit Factor
The profit factor is a metric that tells you, on average, how much you make on winning trades compared to how much you lose on losing trades. A profit factor greater than 1 indicates a profitable strategy, while a value less than 1 suggests a losing one. By analyzing the profit factor, traders can assess the overall performance of their strategy and identify areas for improvement.
The calculation is simple: you take the total profit for all winning trades and divide it by the total loss on all losing trades.
The formula we use: (Return of all wins) / (Return of all losses) = Profit Factor
|
|
Total Return
|
Return of all wins
|
Return of all losses
|
Profit Factor
|
|
System 1
|
1000 USD
|
1500 USD
|
500 USD
|
3
|
|
System 2
|
1000 USD
|
1800 USD
|
800 USD
|
2.25
|
|
System 3
|
1000 USD
|
2000 USD
|
1000 USD
|
2
|
|
System 4
|
1000 USD
|
4000 USD
|
2000 USD
|
2
|
Drawdown
The drawdown chart shows the drawdown (distance) from your account peak.
Your account had a peak of 10.000 USD and your current trading capital is at 7.500 USD. Your drawdown is 25% because you are 25% below your capital high watermark.
When your trading account is currently at an all-time high, the Drawdown is 0%.
R-Multiple
The R-Multiple (Risk Multiple) is a key metric in Edgewonk and trading in general. For the R-Multiple calculation, a Stop Loss is needed because the distance between the entry price and the stop loss is defined as one risk unit.
Let’s say the entry price on a long position is 100 USD with a stop loss at 90 USD. For this trade, one R (one Risk unit) is 10 USD. The R-Multiple then looks at the exit price to determine the outcome in terms of R-Multiple.
The table below provides three examples of different R-Multiple calculations for long trades where each risk unit is 10 USD as determined by the distance between the entry price and the stop loss. The R-Multiple then just takes the distance between the entry price and the exit price to determine the multiple risk units based on the exit.
|
|
Entry price
|
Stop Loss
|
Exit
|
R-Multiple
|
|
Trade 1
|
100 USD
|
90 USD
|
110 USD
|
+1
|
|
Trade 2
|
100 USD
|
90 USD
|
95 USD
|
-0.5
|
|
Trade 3
|
100 USD
|
90 USD
|
120 USD
|
+2
|
Reward:Risk Ratio
The RRR is similar to the R-Multiple but measured at a different time of the trade. Whereas the R-Multiple is measured at the time of the trade exit, the RRR is measured during the entry of the trade.
For the RRR, you measure the following distances:
1) From your entry to your stop loss = Potential Risk
2) From your entry to your target = Potential Reward
The resulting RRR formula is: (Potential Reward / Potential Risk)
|
|
Entry price
|
Stop Loss
|
Take Profit
|
RRR
|
|
Trade 1
|
100 USD
|
90 USD
|
105 USD
|
0.5 : 1
|
|
Trade 2
|
100 USD
|
90 USD
|
110 USD
|
1 :1
|
|
Trade 3
|
100 USD
|
90 USD
|
120 USD
|
2 : 1
|
EW-Score
The Edgewonk score is a performance metric that takes the Profit Factor, the Return to drawdown ratio, and sample size into account.
Price (%)
The price(%) metric refers to the distance between the entry price and the exit price of a trade and, therefore, shows you how far the price has traveled during the trade duration.
The price(%) is positive when the exit price is higher than the entry price.
The price (%) will be negative when the exit price is lower than the entry price.
|
|
Entry
|
Exit
|
Price (%)
|
|
Trade 1
|
100 USD
|
75 USD
|
-25%
|
|
Trade 2
|
100 USD
|
150 USD
|
50%
|
|
Trade 3
|
100 USD
|
110 USD
|
10%
|
Drawdown (%)
The Drawdown (%) column measures how close the price has come to the stop loss of a trade. A drawdown of 100% indicates that the price hit the stop loss. The higher the drawdown, the closer the price has come to the stop loss.
For the drawdown to work properly, each trade needs to have the following data points in Edgewonk: stop loss, highest price, and lowest price.
Updraw (%)
The Updraw (%) column measures how close the price has come to the take profit of a trade. A updraw of 100% indicates that the price hit the take profit. The higher the updraw, the closer the price has come to the take profit.
For the updraw to work properly, each trade needs to have the following data points in Edgewonk: take profit, highest price, and lowest price.
|
|
Entry price
|
Take Profit
|
Highest Price
|
Updraw (%)
|
|
Trade 1 (long)
|
100 USD
|
200 USD
|
200 USD
|
100%
|
|
Trade 2 (long)
|
100 USD
|
200 USD
|
150 USD
|
50%
|
|
Trade 3 (long)
|
100 USD
|
200 USD
|
110 USD
|
10%
|
MAE
MAE in trading stands for Maximum Adverse Excursion. It measures the biggest drawdown a trade experiences while open, regardless of whether it closes in profit.
MFE
MAE in trading stands for Maximum Favorable Excursion. It measures the biggest unrealized profit a trade experiences while open, regardless of whether it closes in a loss.
The table shows the calculation for a long and a short trade. Note that the MAE for long trade take the lowest price into account because it measures the price move against the trade. On the other hand, for a short trade, the MAE takes the highest price into account.
|
|
Entry
|
Highest Price
|
Lowest Price
|
MAE
|
MFE
|
|
Trade 1 (long)
|
100 USD
|
120 USD
|
90 USD
|
10 USD
|
20 USD
|
|
Trade 2 (short)
|
100 USD
|
120 USD
|
90 USD
|
20 USD
|
10 USD
|
Efficiency
The efficiency shows how well you are executing your trading rules. For each trade in Edgewonk, you can assign a trade entry, trade management, and a trade exit comment. The comments can either describe positive, negative, or neutral trading behavior.
The more positive comments you assign to a trade, the higher your efficiency.
Example:
On your last 3 trades, you assigned 7 positive and 2 negative comments. The results in an efficiency of 78% because 7 out of 9 comments are positive.
Sharpe
The Sharpe Ratio measures the realized return in comparison to the risk taken. However, the Sharpe Ratio has a crucial limitation because it penalizes traders for large winners and large losses alike.
The formula we use is: (Sum return of all trades) / (Standard deviation of all returns)
The problem with the Sharpe Ratio is that we get smaller ratios when a trader has large winning trades. Better alternatives to the Sharpe Ratio are the Sortino Ratio and the Gain to Pain ratio.
Sortino
The Sortino Ratio is a risk metric, and it is similar to the Sharpe Ratio, but the Sortino Ratio only penalizes traders for larger losing trades and not for large winning trades as the Sharpe Ratio does.
The formula we use is: (Sum return of all trades) / (Standard deviation of return of all losing trades)
The Sortino Ratio is, therefore, the superior metric because it only looks at the downside risk. A trader who realizes large losing trades will see his Sortino Ratio drop.
Calmar
The Calmar Ratio is another risk metric, looking at the risk component of a trading strategy differently.
The Calmar Ratio uses the maximum drawdown as the risk component.
The formula we use is: (Sum of all returns) / (Max Drawdown)
When comparing two strategies with the same return, the one with the worst drawdown will have a lower Calmar Ratio.
Gain to Pain
The Gain to Pain (GtP) ratio provides information about the realized trading performance, in comparison to the risk that the trader took to achieve that performance.
It is very similar to the Profit Factor, but the Profit Factor just compares the average winning trade and the average losing trade. The GtP ratio, though, compares the return relative to the risk.
When comparing two trading strategies, the one with the higher GtP ratio has taken less risk to achieve the realized return. The lower the GtP, the more risk the trader has taken.
To calculate the GtP we use the following formula:
GtP = (Return of all trades) / (Return of losing trades * -1)
In the example below, all systems realized the same return, but the system with the least amount of total losses has the highest GtP.
The main difference between the Profit Factor and the Gain to Pain becomes obvious when comparing systems 3 and 4. Whereas both have the same Profit Factor, the Gain to Pain for system 4 is much lower due to the higher negative return, indicating more risk.
|
|
Total Return
|
Return of all wins
|
Return of all losses
|
Profit Factor
|
Gain to Pain
|
|
System 1
|
1000 USD
|
1500 USD
|
500 USD
|
3
|
2
|
|
System 2
|
1000 USD
|
1800 USD
|
800 USD
|
2.25
|
1,25
|
|
System 3
|
1000 USD
|
2000 USD
|
1000 USD
|
2
|
1
|
|
System 4
|
1000 USD
|
4000 USD
|
2000 USD
|
2
|
0.25
|
By now, you've been armed with a comprehensive understanding of the trading performance statistics within your Edgewonk journal. Remember, consistent tracking and analysis are key. As you diligently record your trades and delve deeper into these metrics, you'll gain invaluable insights into your strengths, weaknesses, and areas for improvement. So, put your newfound knowledge to the test, leverage your journal's power, and watch your trading journey flourish!


 For New Traders
 For Breakeven Traders
 For Profitable Traders